Part 4: Choose your own advecnture! (7 Points; Optional for Extra Credit)
Part 4: Choose your own advecnture! (7 Points; Optional for Extra Credit)
This section is open ended and your chance to explare any advanced analysis. Please perform any additional analysis you find interesting! Suggested analyses (only do one max):
Topic evolution over time - see https://
maartengr .github .io /BERTopic /getting _started /topicsovertime /topicsovertime .html #visualization Word frequency over time - does the frequency of certain words change over time
Semantic similarity - investigate similarity within and between presidents or time periods. For example, similarity between one presidents speeches, e.g. are all of Biden’s speeches similar to each other? How similar are they to Trump’s speeches? Are speeches from the 2000s more similar to each other than speeches in the 1800s? Which two presidents have the most similar speeches? See https://
spacy .io /usage /linguistic -features #vectors -similarity Named Entity Recognition - which entity types are most common in speeches? What are the most common words for each entity type - see https://
spacy .io /usage /linguistic -features #named -entities Classification - can you build a classifier to detect democratic versus republican state of the union speeches from 1980-2024 - see https://
scikit -learn .org /stable /auto _examples /text /plot _document _classification _20newsgroups .html #sphx -glr -auto -examples -text -plot -document -classification -20newsgroups -py
import spacy
spacy.cli.download("en_core_web_sm")
Collecting en-core-web-sm==3.8.0
Downloading https://github.com/explosion/spacy-models/releases/download/en_core_web_sm-3.8.0/en_core_web_sm-3.8.0-py3-none-any.whl (12.8 MB)
━━━━━━━━━━━━━━━━━━━━━━━━━━━━━━━━━━━━━━━━ 12.8/12.8 MB 77.5 MB/s eta 0:00:0000:01
✔ Download and installation successful
You can now load the package via spacy.load('en_core_web_sm')
⚠ Restart to reload dependencies
If you are in a Jupyter or Colab notebook, you may need to restart Python in
order to load all the package's dependencies. You can do this by selecting the
'Restart kernel' or 'Restart runtime' option.
# make a path for the outputs
from pathlib import Path

OUTPUT_DIR = Path("outputs")
OUTPUT_DIR.mkdir(exist_ok=True)
import pandas as pd
sou = pd.read_csv("data/SOTU.csv")
sou_21cen = sou[sou["Year"] >= 2000].reset_index(drop=True)import spacy
from tqdm import tqdm
nlp = spacy.load("en_core_web_sm")
# process speeches
processed_speech = [nlp(text) for text in tqdm(sou_21cen["Text"])]100%|██████████| 25/25 [00:24<00:00, 1.01it/s]
from sklearn.feature_extraction.text import TfidfVectorizer

tfidf = TfidfVectorizer(stop_words="english")
tfidf_matrix = tfidf.fit_transform(sou_21cen["Text"])


tfidf_df = pd.DataFrame(tfidf_matrix.toarray(), columns=tfidf.get_feature_names_out())

# add president label
tfidf_df["President"] = sou_21cen["President"].values
tfidf_df.head()# group by president and obtain means
president_vectors = tfidf_df.groupby("President").mean()
president_vectorsfrom sklearn.decomposition import PCA
import matplotlib.pyplot as plt
import mpld3
# plot pca analysis -- which presidents had most similar speeches
pca = PCA(n_components=2)
coords = pca.fit_transform(president_vectors)
pca_df = pd.DataFrame(coords, columns=["PC1", "PC2"],
index=president_vectors.index)
fig, ax = plt.subplots(figsize=(8,6))
for name, row in pca_df.iterrows():
plt.scatter(row["PC1"], row["PC2"])
plt.text(row["PC1"] + 0.01, row["PC2"] + 0.01, name, fontsize=9)
plt.title("Presidents' Speeches (PCA on TF–IDF)")
plt.xlabel("PC1")
plt.ylabel("PC2")
plt.axhline(0, color="gray", linewidth=0.5)
plt.axvline(0, color="gray", linewidth=0.5)
plt.show()
# save as html
mpld3.save_html(fig, str(OUTPUT_DIR / "president_speeches_PCA.html"))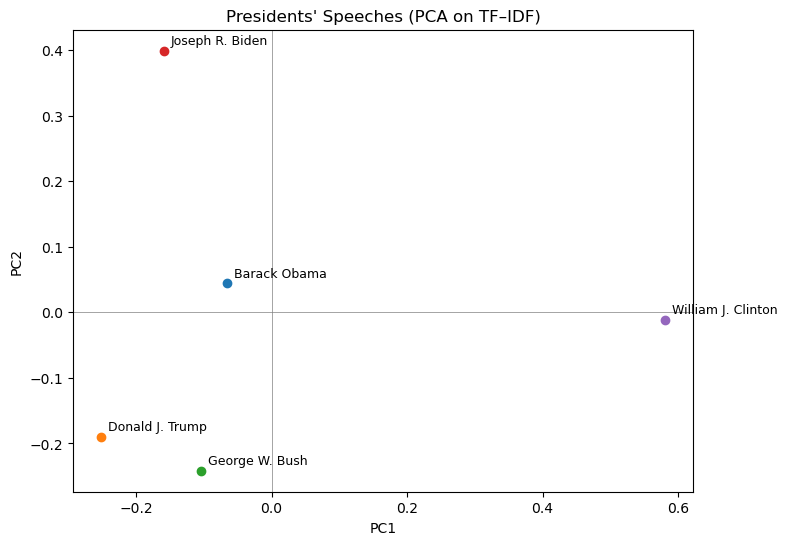
/srv/conda/envs/notebook/lib/python3.12/site-packages/mpld3/mplexporter/exporter.py:84: UserWarning: Blended transforms not yet supported. Zoom behavior may not work as expected.
  warnings.warn("Blended transforms not yet supported. "
The PCA plot shows Biden and Obama close together, reflecting similar modern Democratic language and overlapping vocabulary (of course, they of course also shared two terms together). Trump and Bush cluster nearer each other, suggesting overlap in Republican themes. Interestingly, Clinton appears farther from both groups, likely because his speeches predate the 2000s shift in political language (i.e. pre-9/11), making his rhetorical style more distinct.