The data for this project is stored in the data folder in your repositories, in the SOTU.csv file. The data file is structured as a CSV with columns for president name, speech text, year, and word count in the speech.
import pandas as pd
import matplotlib.pyplot as plt
import seaborn as sns
import spacy

plt.style.use('seaborn-v0_8-dark')
# make a path for the outputs
from pathlib import Path
OUTPUT_DIR = Path("outputs")
OUTPUT_DIR.mkdir(exist_ok=True)Import the Data
# load data
sou = pd.read_csv("data/SOTU.csv")
souNumber of Speeches per President
# looking at the count of speeches per president
order  = sou["President"].unique()
speech_by_president = sou["President"].value_counts().reindex(order)
# making the bar graph
plt.figure(figsize=(16, 6))
speech_by_president.plot(kind="bar")
plt.title("Number of Speeches per President")
plt.ylabel("Count")
plt.savefig(OUTPUT_DIR / "num_speeches_per_president.png", bbox_inches="tight")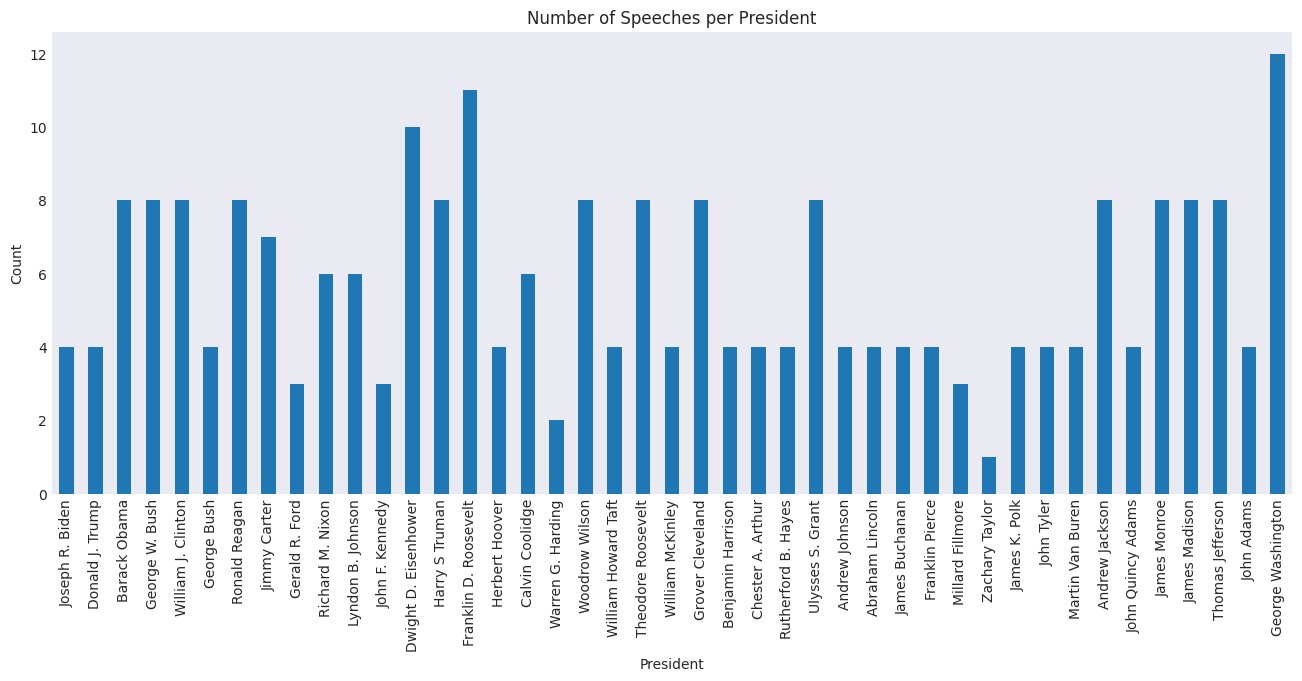
The president with the highest number of speeches was George Washington while the president with the lowest number was Zachary Taylor. The most recent presidents Donald Trump and Joe Biden have a lower number of speeches (4 speeches).
Number of Speeches per year
# looking at the number of speeches by year
speech_by_year = sou.groupby("Year").size()
speech_by_year
Year
1790.0 4
1791.0 2
1792.0 2
1793.0 1
1794.0 1
..
2020.0 1
2021.0 1
2022.0 1
2023.0 1
2024.0 1
Length: 232, dtype: int64# making the line graph
plt.plot(speech_by_year.index, speech_by_year.values)
plt.xlabel("Year")
plt.ylabel("Number of Speeches")
plt.title("Number of SOTU Speeches per Year")
plt.savefig(OUTPUT_DIR / "speeches_per_year.png", bbox_inches="tight")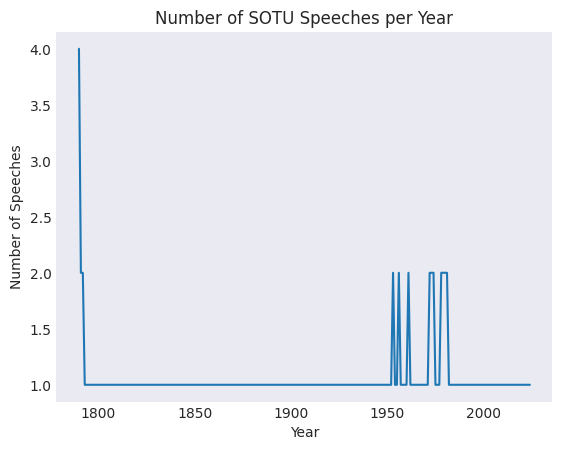
The number of SOTU speeches per year dropped to 1 speech per year in the year 1800. Afterwards, it remained at 1 speech a year until the year 1950. There were small peaks (2 speeches per year) from the years 1950 to around 1980. Afterwards, it dropped back to 1 speech per year and remained there.
Word Count Distribution
# looking at the distribution of the speech word counts
speech_by_wordcount = sou.groupby("Word Count").size()
speech_by_wordcount
Word Count
1055 2
1069 4
1353 1
1491 1
1815 1
..
24983 1
27183 1
27238 1
27312 1
33065 1
Length: 232, dtype: int64# making the histogram
sns.histplot(sou["Word Count"])
plt.title("Distribution of State of the Union Speech Word Counts")
plt.savefig(OUTPUT_DIR / "wordcount_hist.png", bbox_inches="tight")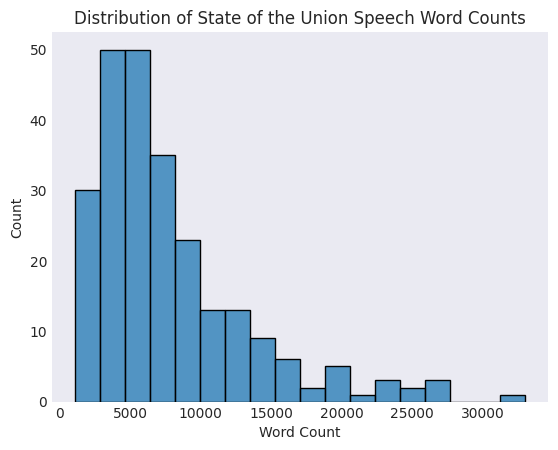
The distribution of the SOTU word counts is heavily skewed right. The median seems to be around 5000 or so.
Word Count Distribution Accross Years
# making a rugplot of the word count distribution across years
sns.scatterplot(x=sou["Word Count"], y=sou["Year"])
sns.rugplot(x=sou["Word Count"])
sns.rugplot(y=sou["Year"])
plt.title("Speech Year Versus Word Count")
plt.savefig(OUTPUT_DIR / "wordcount_over_years.png", bbox_inches="tight")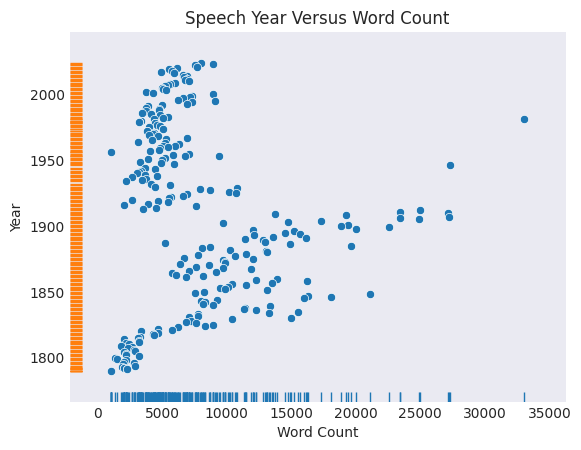
There does not seem to be a strong relationship between speech word count and year.
Average Word Count Per President
# displaying the mean word counts per president
speech_mean = sou.groupby("President")["Word Count"].mean().reindex(order)
speech_mean
President
Joseph R. Biden 8063.500000
Donald J. Trump 5586.500000
Barack Obama 6624.000000
George W. Bush 4971.750000
William J. Clinton 7457.625000
George Bush 4357.500000
Ronald Reagan 4482.875000
Jimmy Carter 7874.714286
Gerald R. Ford 4495.666667
Richard M. Nixon 4427.333333
Lyndon B. Johnson 4715.833333
John F. Kennedy 5555.000000
Dwight D. Eisenhower 4703.500000
Harry S Truman 8131.625000
Franklin D. Roosevelt 3476.090909
Herbert Hoover 6251.500000
Calvin Coolidge 8529.833333
Warren G. Harding 5612.500000
Woodrow Wilson 4311.625000
William Howard Taft 22335.750000
Theodore Roosevelt 19505.125000
William McKinley 18380.000000
Grover Cleveland 13798.250000
Benjamin Harrison 13507.500000
Chester A. Arthur 10031.250000
Rutherford B. Hayes 10784.000000
Ulysses S. Grant 8879.375000
Andrew Johnson 9485.500000
Abraham Lincoln 6746.250000
James Buchanan 13993.000000
Franklin Pierce 10377.000000
Millard Fillmore 10414.000000
Zachary Taylor 7559.000000
James K. Polk 17885.750000
John Tyler 8457.500000
Martin Van Buren 11261.250000
Andrew Jackson 11160.500000
John Quincy Adams 7662.500000
James Monroe 5224.500000
James Madison 2681.000000
Thomas Jefferson 2558.875000
John Adams 1769.250000
George Washington 1880.083333
Name: Word Count, dtype: float64# making the bar graph
speech_mean.plot.bar(figsize=(16,6))
plt.title("Average State of the Union Word Count per President")
plt.ylabel("Average Word Count")
plt.savefig(OUTPUT_DIR / "avg_wordcount_per_president.png", bbox_inches="tight")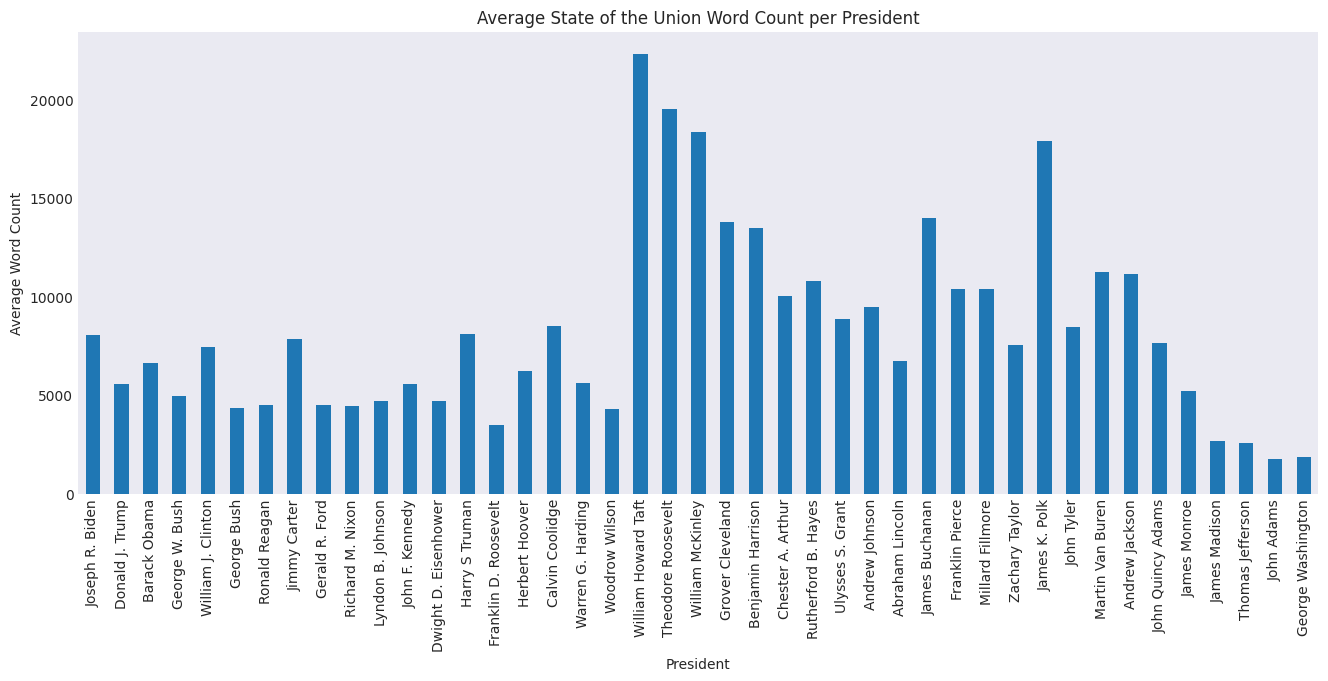
Generally, the more recent presidents seem to have a lower average word count for their SOTU speeches than older presidents although John Adams and George Washington did have the lowest average word counts. William Howard Taft had the highest average word count over 20,000 words.