Analysis Question: Which food categories have had the fastest increase in prices over the past 20–50 years?
We will explore this question using two preprocessed forecast datasets:
Historical Consumer Price Index (CPI) forecast series
Historical Producer Price Index (PPI) forecast series
Each contains annual percent-change forecasts by food-related category from 1974–2024.
To quantify “fastest increase,” we will measure the average annual percent change in each category over different time windows:
A long-run window (~50 years): 1974–2024*
A recent window (20 years): 2004–2024
For each dataset (CPI and PPI), we will:
Convert wide data to tidy long format (
Year,category,pct_change)Compute mean annual inflation by category within each window
Rank categories and identify the top 5 fastest-inflating categories
Compare whether categories that inflate quickly in CPI also do so in PPI
Imports + Load Data
import os
import pandas as pd
import matplotlib.pyplot as plt
import sys
sys.path.append('..')  # Just add the parent directory for utils
from utils.data_loader import load_inflation_data
from utils.transformers import reshape_to_long_format

plt.rcParams["figure.figsize"] = (14, 6)
plt.rcParams["axes.grid"] = True

# Load processed data
cpi_wide, ppi_wide = load_inflation_data()

display(cpi_wide.head())
display(ppi_wide.head())Convert to tidy long format
The preprocessed files are in wide format (one column per category). For analysis, we will convert them to long format with columns:
Yearcategorypct_change(annual percent change forecast)
cpi_long = reshape_to_long_format(cpi_wide)
ppi_long = reshape_to_long_format(ppi_wide)

display(cpi_long.head())
display(ppi_long.head())Defining the metric: average annual percent change
For each category and time window, we compute `pct_change,’ which is the annual percent change forecast in that category. A higher value means the category is, on average, expected to experience faster price growth in that period.
# Helper function:
def mean_inflation_by_category(df_long: pd.DataFrame,
                               start_year: int,
                               end_year: int) -> pd.Series:
    """
    Compute mean annual percent change per category within a given year window.

    Parameters
    ----------
    df_long : pd.DataFrame
        Long-format data with columns: Year, category, pct_change.
    start_year : int
        Inclusive start of the window.
    end_year : int
        Inclusive end of the window.

    Returns
    -------
    pd.Series
        Mean pct_change per category, sorted descending order.
    """
    window = df_long[
        (df_long["Year"] >= start_year) & (df_long["Year"] <= end_year)
    ]
    means = (
        window.groupby("category")["pct_change"]
        .mean()
        .sort_values(ascending=False)
    )
    return means

# Define Time Windows:
full_start, full_end = 1974, 2024   # ~50-year window
recent_start, recent_end = 2004, 2024  # Last 20 years
CPI: Fastest-inflating categories (long-run vs last 20 years)
We first look at CPI forecasts and compute average annual inflation by category for:
1974–2024 (approximately 50 years)
2004–2024 (recent 20-year window)
Compute Means
cpi_mean_full = mean_inflation_by_category(cpi_long, full_start, full_end)
cpi_mean_recent = mean_inflation_by_category(cpi_long, recent_start, recent_end)

display(cpi_mean_full.head())
display(cpi_mean_recent.head())
category
Sugar_and_sweets 4.588235
Fresh_fruits 4.576471
Cereals_and_bakery_products 4.321569
Food_away_from_home 4.278431
Fresh_fruits_and_vegetables 4.268627
Name: pct_change, dtype: float64category
Beef_and_veal 4.395238
Eggs 4.304762
Fats_and_oils 3.519048
Food_away_from_home 3.423810
Meats 3.376190
Name: pct_change, dtype: float64Top 5 Tables
cpi_top5_full = cpi_mean_full.head(5)
cpi_top5_recent = cpi_mean_recent.head(5)

display(cpi_top5_full)
display(cpi_top5_recent)
category
Sugar_and_sweets 4.588235
Fresh_fruits 4.576471
Cereals_and_bakery_products 4.321569
Food_away_from_home 4.278431
Fresh_fruits_and_vegetables 4.268627
Name: pct_change, dtype: float64category
Beef_and_veal 4.395238
Eggs 4.304762
Fats_and_oils 3.519048
Food_away_from_home 3.423810
Meats 3.376190
Name: pct_change, dtype: float64Bar Plots
fig, ax = plt.subplots()
cpi_top5_full.plot(kind="barh", ax=ax)
plt.gca().invert_yaxis() # top to bottom
ax.set_title("CPI: Top 5 Fastest-Inflating Categories (1974–2024)")
ax.set_xlabel("Average annual percent change")
plt.tight_layout()
plt.savefig('../figures/cpi_top_5_inflating_categories_1974_2024.png')
plt.show()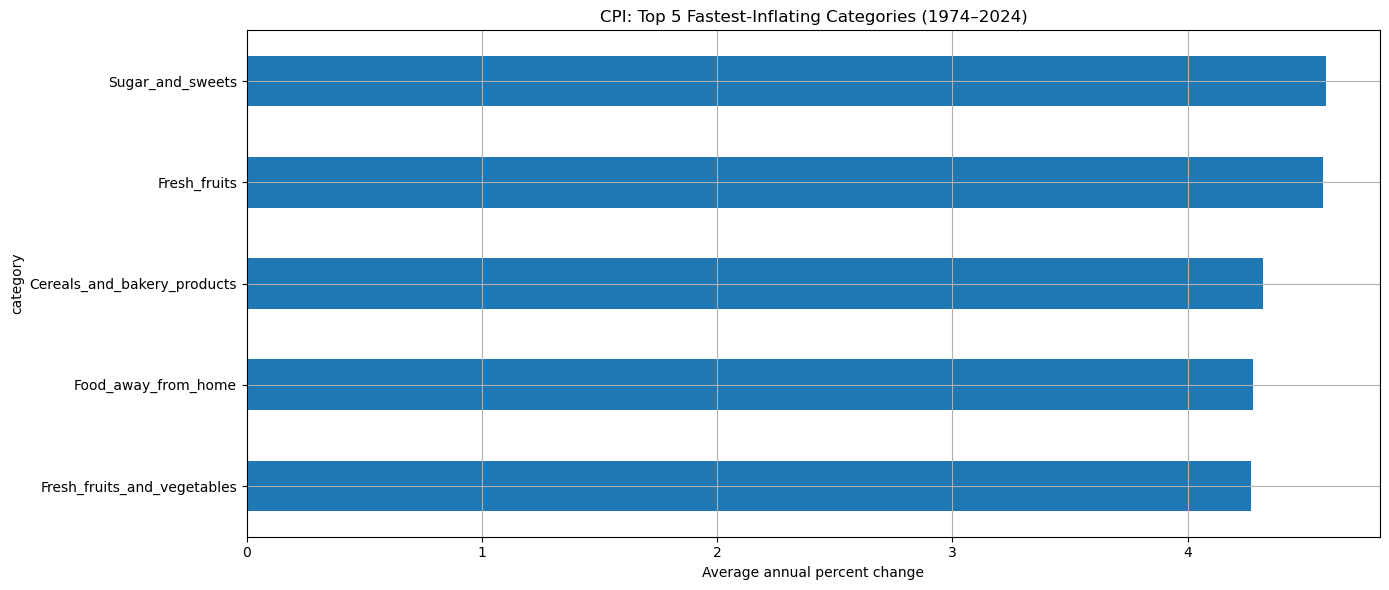
fig, ax = plt.subplots()
cpi_top5_recent.plot(kind="barh", ax=ax)
plt.gca().invert_yaxis() # top to bottom
ax.set_title("CPI: Top 5 Fastest-Inflating Categories (2004–2024)")
ax.set_xlabel("Average annual percent change")
plt.tight_layout()
plt.savefig('../figures/cpi_top_5_inflating_categories_2004_2024.png')
plt.show()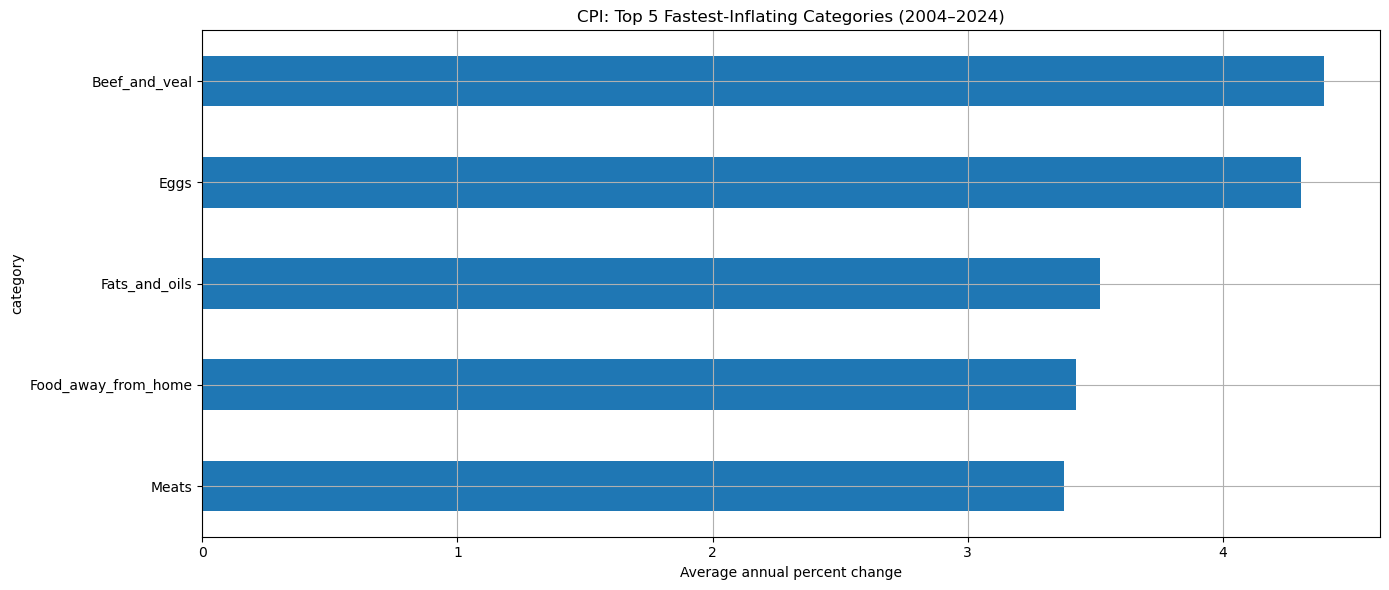
PPI: Fastest-inflating categories (long-run vs last 20 years)
We will now repeat the same analysis using PPI forecasts, which focus on producer-level prices.
Compute means
ppi_mean_full = mean_inflation_by_category(ppi_long, full_start, full_end)
ppi_mean_recent = mean_inflation_by_category(ppi_long, recent_start, recent_end)

display(ppi_mean_full.head())
display(ppi_mean_recent.head())
category
Farm_level_eggs 6.534694
Wholesale_fats_and_oils 4.131373
Farm_level_milk 3.476471
Farm_level_vegetables 3.450980
Wholesale_beef 3.409804
Name: pct_change, dtype: float64category
Farm_level_eggs 13.176190
Farm_level_wheat 5.128571
Farm_level_milk 4.914286
Wholesale_fats_and_oils 4.890476
Farm_level_vegetables 4.747619
Name: pct_change, dtype: float64Top 5 Tables
ppi_top5_full = ppi_mean_full.head(5)
ppi_top5_recent = ppi_mean_recent.head(5)

display(ppi_top5_full)
display(ppi_top5_recent)
category
Farm_level_eggs 6.534694
Wholesale_fats_and_oils 4.131373
Farm_level_milk 3.476471
Farm_level_vegetables 3.450980
Wholesale_beef 3.409804
Name: pct_change, dtype: float64category
Farm_level_eggs 13.176190
Farm_level_wheat 5.128571
Farm_level_milk 4.914286
Wholesale_fats_and_oils 4.890476
Farm_level_vegetables 4.747619
Name: pct_change, dtype: float64Bar Plots
fig, ax = plt.subplots()
ppi_top5_full.plot(kind="barh", ax=ax)
plt.gca().invert_yaxis() # top to bottom
ax.set_title("PPI: Top 5 Fastest-Inflating Categories (1974–2024)")
ax.set_xlabel("Average annual percent change")
plt.tight_layout()
plt.savefig('../figures/ppi_top_5_inflating_categories_1974_2024.png')
plt.show()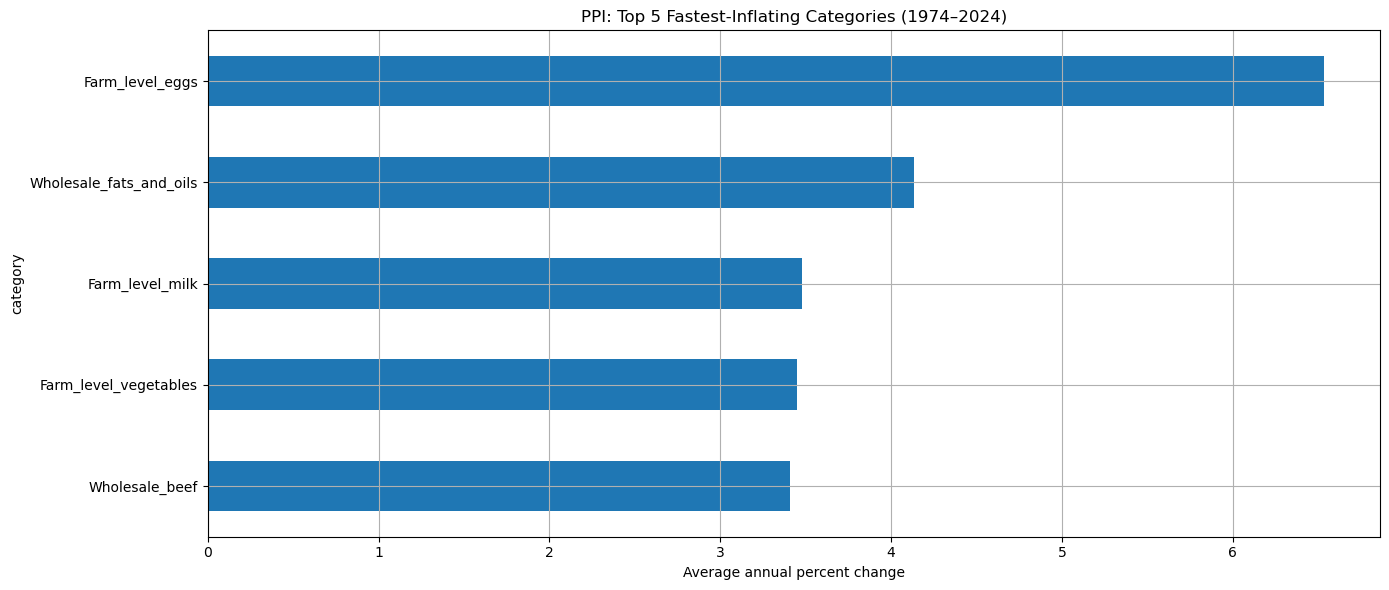
fig, ax = plt.subplots()
ppi_top5_recent.plot(kind="barh", ax=ax)
plt.gca().invert_yaxis() # top to bottom
ax.set_title("PPI: Top 5 Fastest-Inflating Categories (2004–2024)")
ax.set_xlabel("Average annual percent change")
plt.tight_layout()
plt.savefig('../figures/ppi_top_5_inflating_categories_2004_2024.png')
plt.show()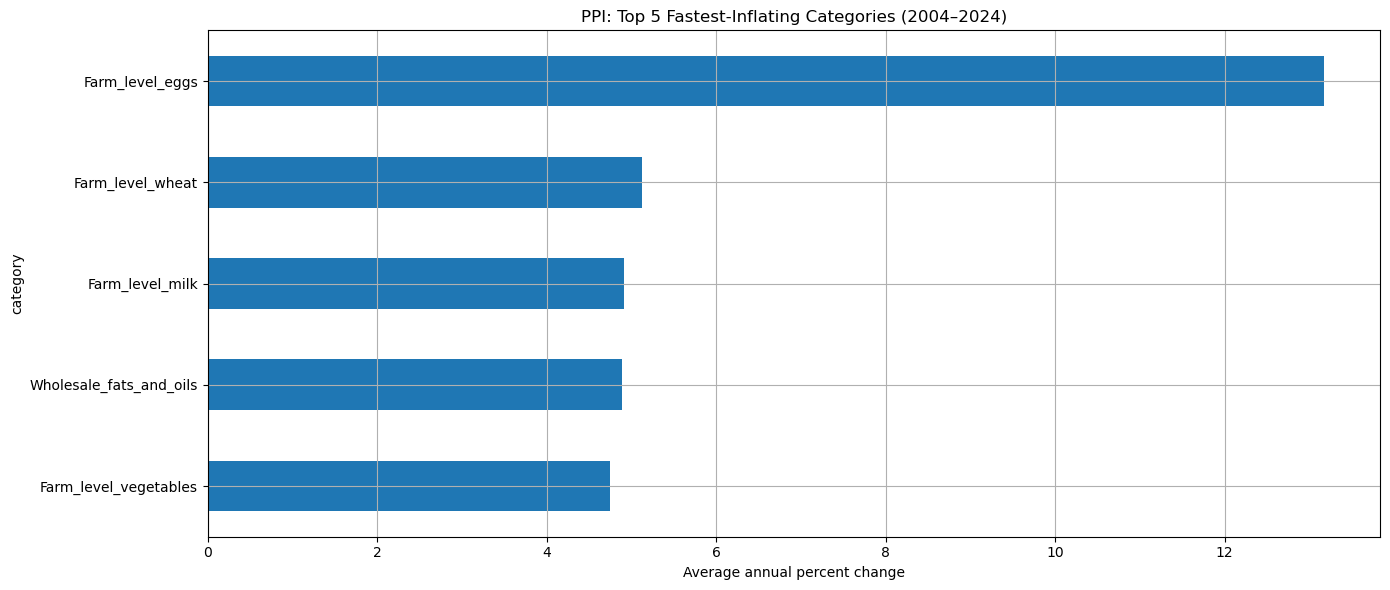
Side-by-Side Comparison Tables
CPI:
cpi_q1_summary = pd.DataFrame({
    "CPI_top5_full": cpi_top5_full.index,
    "CPI_full_mean": cpi_top5_full.values,
    "CPI_top5_recent": cpi_top5_recent.index,
    "CPI_recent_mean": cpi_top5_recent.values,
})

cpi_q1_summaryPPI:
ppi_q1_summary = pd.DataFrame({
    "PPI_top5_full": ppi_top5_full.index,
    "PPI_full_mean": ppi_top5_full.values,
    "PPI_top5_recent": ppi_top5_recent.index,
    "PPI_recent_mean": ppi_top5_recent.values,
})

ppi_q1_summaryCombine CPI + PPI into a single comparison table
combined_q1_summary = pd.DataFrame({
    "CPI_top5_full": cpi_top5_full.index,
    "CPI_full_mean": cpi_top5_full.values,
    "PPI_top5_full": ppi_top5_full.index,
    "PPI_full_mean": ppi_top5_full.values,
    "CPI_top5_recent": cpi_top5_recent.index,
    "CPI_recent_mean": cpi_top5_recent.values,
    "PPI_top5_recent": ppi_top5_recent.index,
    "PPI_recent_mean": ppi_top5_recent.values,
})

combined_q1_summarySaving Results
# make a directory called food_price_trend_summary under ../outputs/
save_directory = "../outputs/food_price_trend_summary/"
os.makedirs(save_directory, exist_ok=True)

# Save CPI results:
cpi_mean_full.to_csv(save_directory + "cpi_mean_full_window.csv")
cpi_mean_recent.to_csv(save_directory + "cpi_mean_recent_window.csv")
cpi_q1_summary.to_csv(save_directory + "q1_cpi_top5_summary.csv", index=False)

# Save PPI results:
ppi_mean_full.to_csv(save_directory + "ppi_mean_full_window.csv")
ppi_mean_recent.to_csv(save_directory + "ppi_mean_recent_window.csv")
ppi_q1_summary.to_csv(save_directory + "q1_ppi_top5_summary.csv", index=False)

# Save combined CPI + PPI comparison table:
combined_q1_summary.to_csv(save_directory + "q1_combined_cpi_ppi_summary.csv",
                           index=False)

print("All Q1 outputs saved successfully!")
All Q1 outputs saved successfully!