Authors: Alistair Clark, Emily Hsu, Fiona Li, Thomas Lee
Introduction
Food prices affect households every day, and changes in food inflation can have especially large impacts on lower-income families. While overall inflation often receives public attention, food inflation can behave differently across time periods and food categories due to supply-chain disruptions, agricultural shocks, and broader economic conditions. In this project, we analyze long-run food inflation in the United States using Consumer Price Index (CPI) and Producer Price Index (PPI) data from 1974 to 2024. Our goal is to understand how food inflation has evolved over time, how it differs across major economic periods, and how inflation dynamics vary across food categories. This overview notebook summarizes our main findings and results. Detailed analysis,  and Producer Price Index (PPI), published by the Bureau of Labor Statistics and the USDA Economic Research Service: USDA Food Price Outlook Data Products
The CPI reflects prices paid by consumers, while the PPI captures price changes earlier in the supply chain. Our primary assumption is that these datasets provide a consistent and representative measure of food price inflation over time. Because the data are annual, our analysis focuses on long-run trends and regime changes rather than short-term seasonal fluctuations. While our findings are specific to U.S. food markets, many of the observed patterns likely reflect broader structural forces affecting food prices.
Data Cleaning and Processing
The raw data from the USDA Economic Research Service (ERS) required significant preprocessing to be suitable for time-series analysis. We established a reproducible ETL (Extract, Transform, Load) pipeline:
String Normalization: Raw category names contained spaces, commas, and hyphens (e.g., “Meats, poultry, and fish”). These were sanitized into snake_case (e.g., meats_poultry_and_fish) to ensure they could serve as valid Python variables and column headers.
Pivoting (Wide Format): The raw input data was restructured into a time-series matrix where the Index is the Year, and columns represent individual Food Categories. This “Wide” format is essential for calculating correlation matrices and rolling statistics.
Melting (Long Format): For visualization in Seaborn, we implemented a dynamic reshaping function (reshape_to_long_format) to convert the data into “Tidy” format, allowing for multi-category trend comparison.
Temporal Smoothing: To handle annual volatility and identify long-term inflation regimes, we engineered new features using a 5-year rolling window, calculating both the Rolling Mean (trend) and Rolling Standard Deviation (volatility).
Data Exploration
To explore our primary dataset, we explored and visualized inflation patterns in the Historical Consumer Price Index (CPI) and Historical Producer Price Index (PPI) forecast series. Both datasets contain annual percent-change forecasts from 1974–2024 for multiple food-related categories.
Specifically, we examined (1) inflation trends over time via line plots, (2) cross-category comparisons using bar charts, (3) the top 5 fastest-inflating categories, and (5) the most volatile categories (as measured by standard deviation), as part of our initial data exploration.
Line plots of inflation over time:
Since line plots can show how forecast inflation changes year-to-year for each category, we first examine inflation trends over time via line plots.
By plotting all categories in each dataset, we can visually inspect:
Long-run trends in food price forecasts
Periods of high inflation (e.g., 1970s, post-2020)
How different categories move together or diverge We first start with CPI, then repeat for PPI.
CPI Line Plot:
Aggregate Food Inflation Over Time
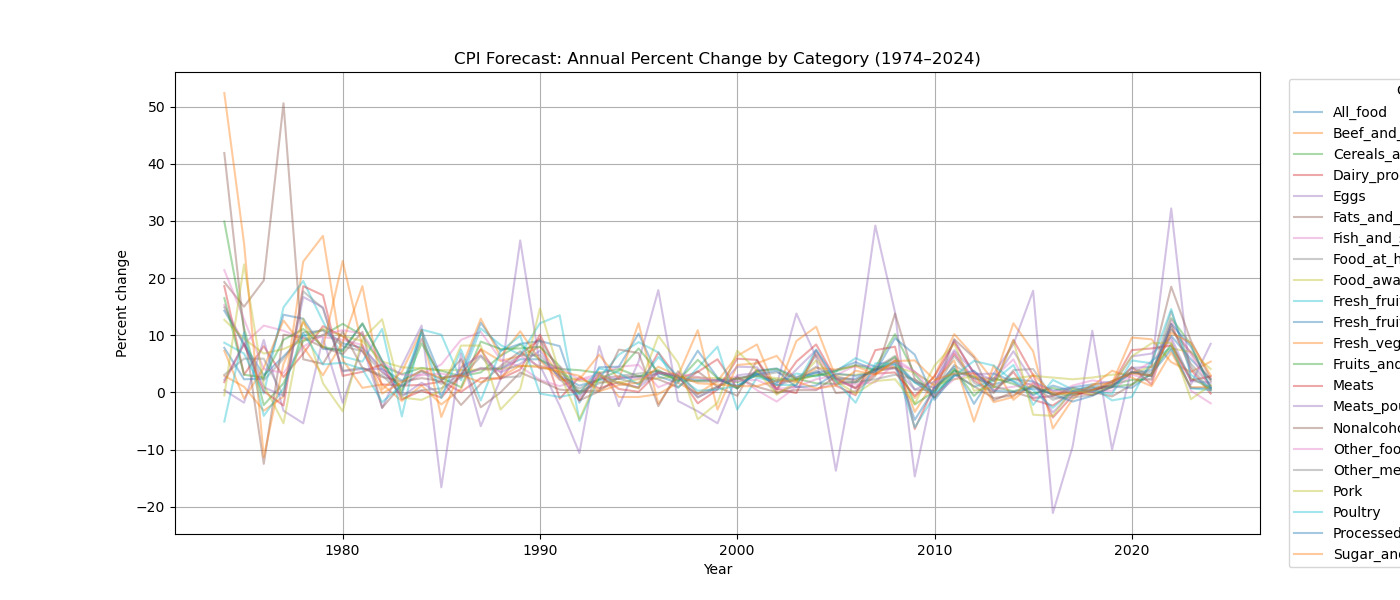
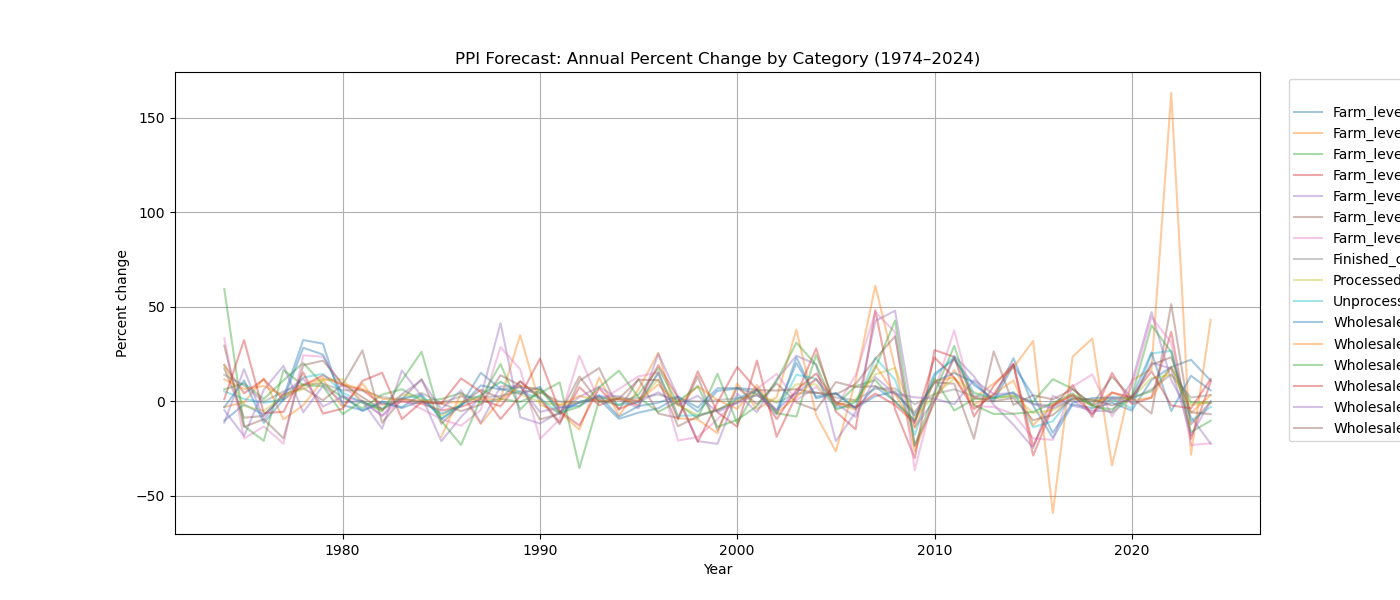
First, we can begin by examining trends in annual percent change of food inflation by inspecting the CPI plot, which shows clear spikes during the late 1970s and early 1980s, followed by several decades of relatively low and stable inflation. Annual percent change in food inflation rises sharply again after 2020. On the other hand, visual inspection of the above line plot for PPI does not show these spikes in the late 1970s and 1980s, suggesting that CPI and PPI do not trend directly with each other.
Rather, spikes (of varying magnitudes) appear in the PPI line plot during the 2020s. However, we can generally see that most categories follow similar trends as one another for both CPI and PPI, and annual percent change generally stays within a magnitude of + and - 10% for CPI, and + and - 50% for PPI.
To assess whether long-run inflation trends have changed, we can also estimate a broken-stick regression that allows the inflation trend to shift gradually over time. This model identifies a breakpoint around 1985, marking a transition from declining inflation to a flatter long-run pattern. The broken-stick model fits the data much better than a simple linear trend, suggesting that food inflation evolves smoothly rather than through sudden structural breaks.
Formal change-point detection supports this conclusion: when using conservative settings, no sharp breaks are detected. Together, these results indicate that food inflation is shaped by slow-moving structural forces rather than abrupt regime shifts.
Bar charts comparing categories:
To compare categories more directly, we can collapse the time dimension and compute the average annual percent change for each category. This will give us a single summary number for each category, which we visualize with bar charts. Higher means indicate categories that, on average, are forecasted to inflate more quickly.
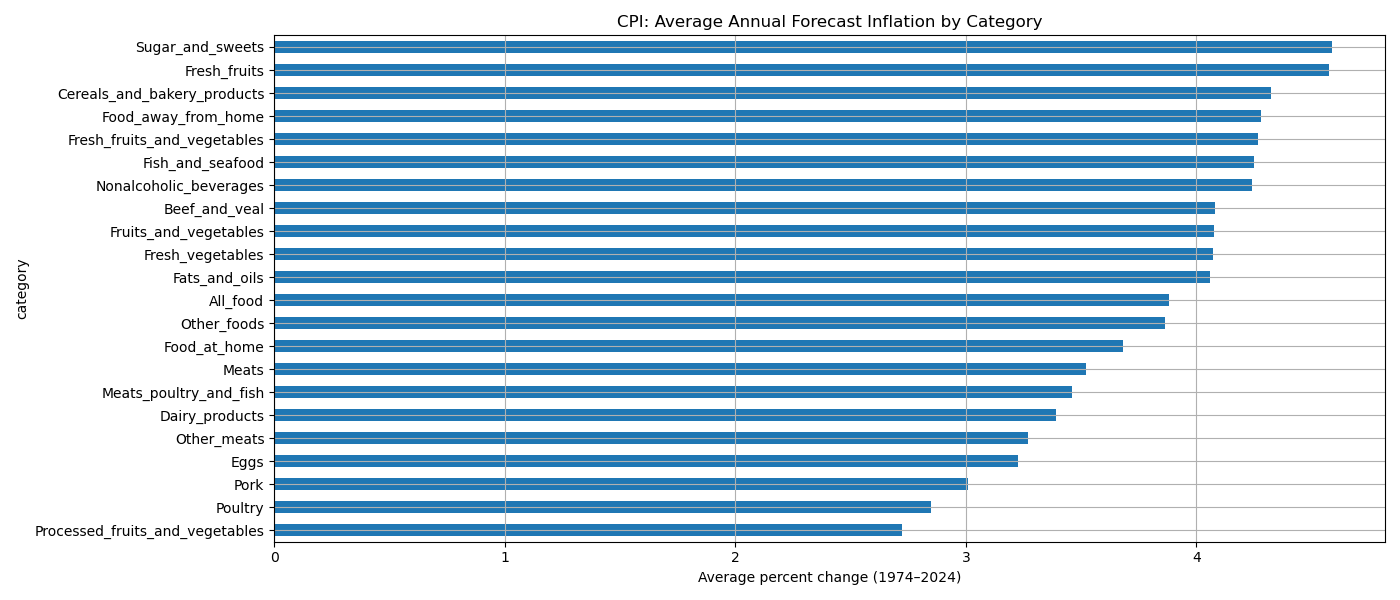
To identify the categories that inflate more quickly, on average, we zoom in on the top 5 fastest-inflating categories. Top 5 fastest-inflating categories: Next, we explicitly rank categories by their average annual forecast inflation and highlight the top 5 for each dataset. These categories represent the food items with the most persistent upward price pressure in the forecast data.
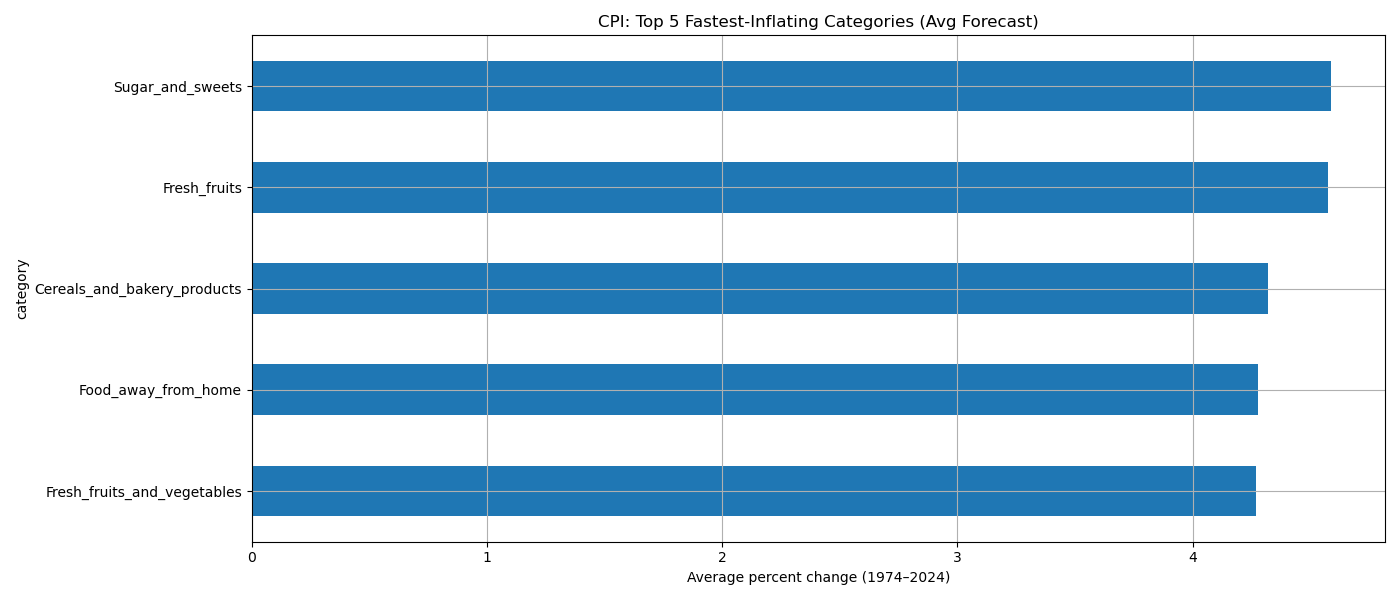
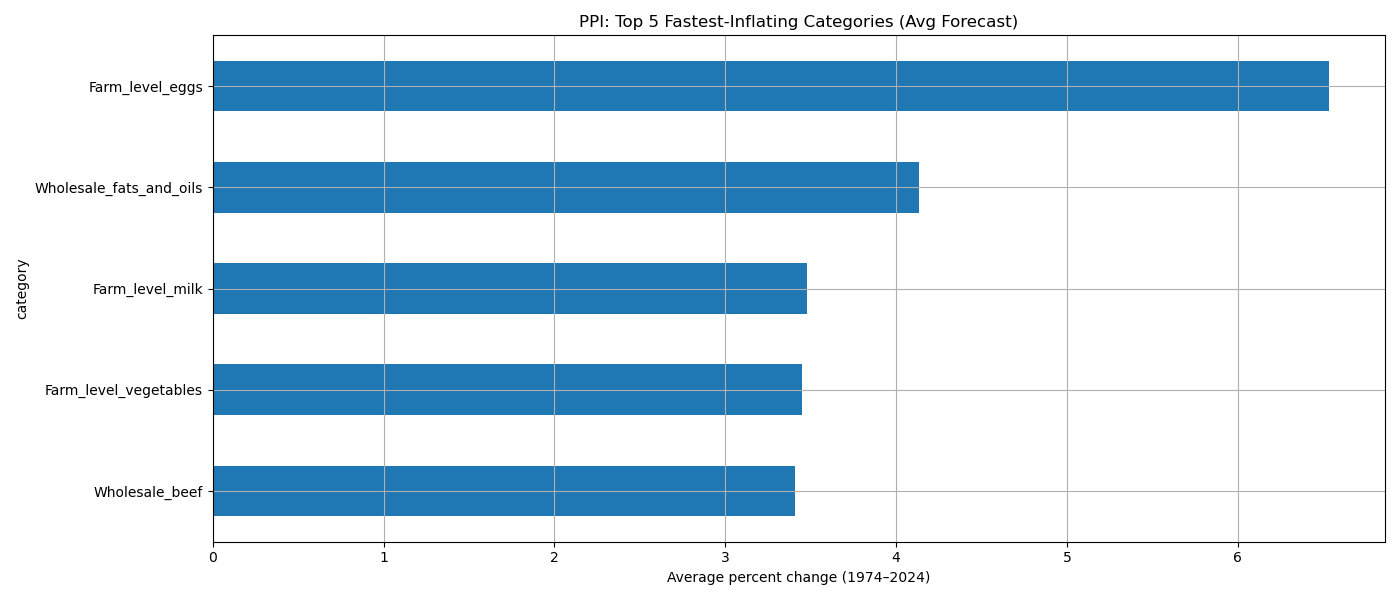
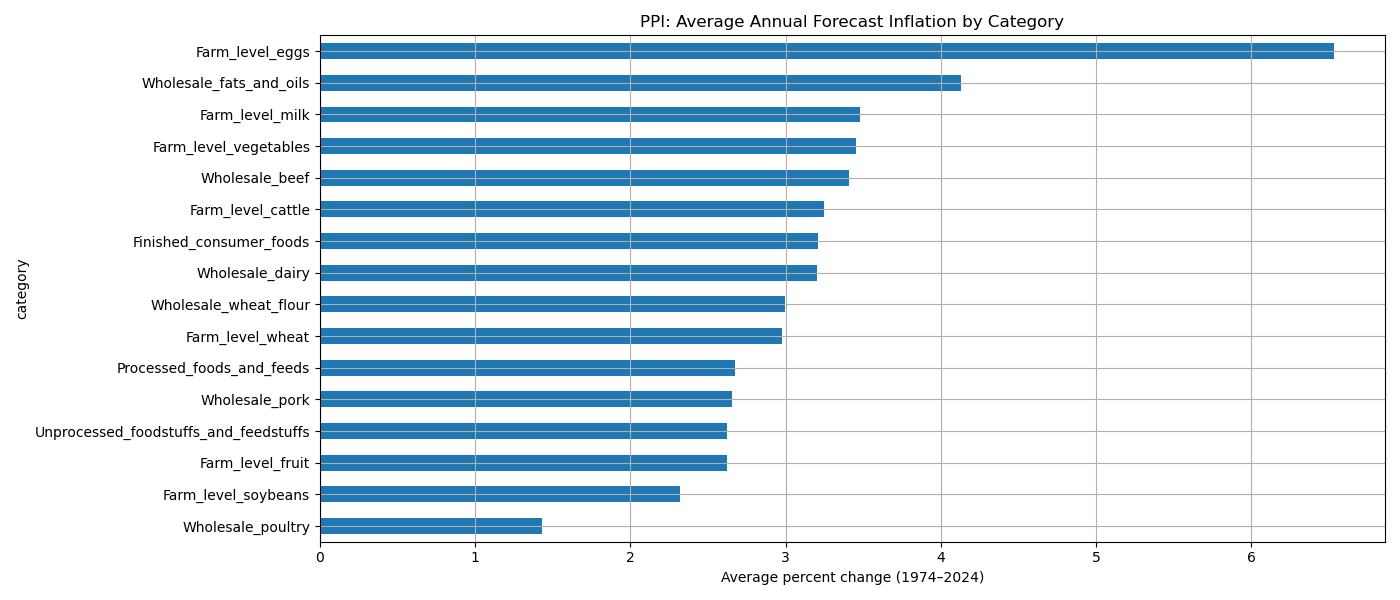
Interestingly, although the groupings are not exactly one-to-one across CPI and PPI, the top 5 fastest-inflating categories differ substantially across the two (with only some overlap of vegetables). Most volatile categories (year-to-year): To measure how unstable inflation forecasts are, we look at the standard deviation of the annual percent change for each category. A higher standard deviation means the category’s inflation forecast fluctuates more from year to year (higher volatility).
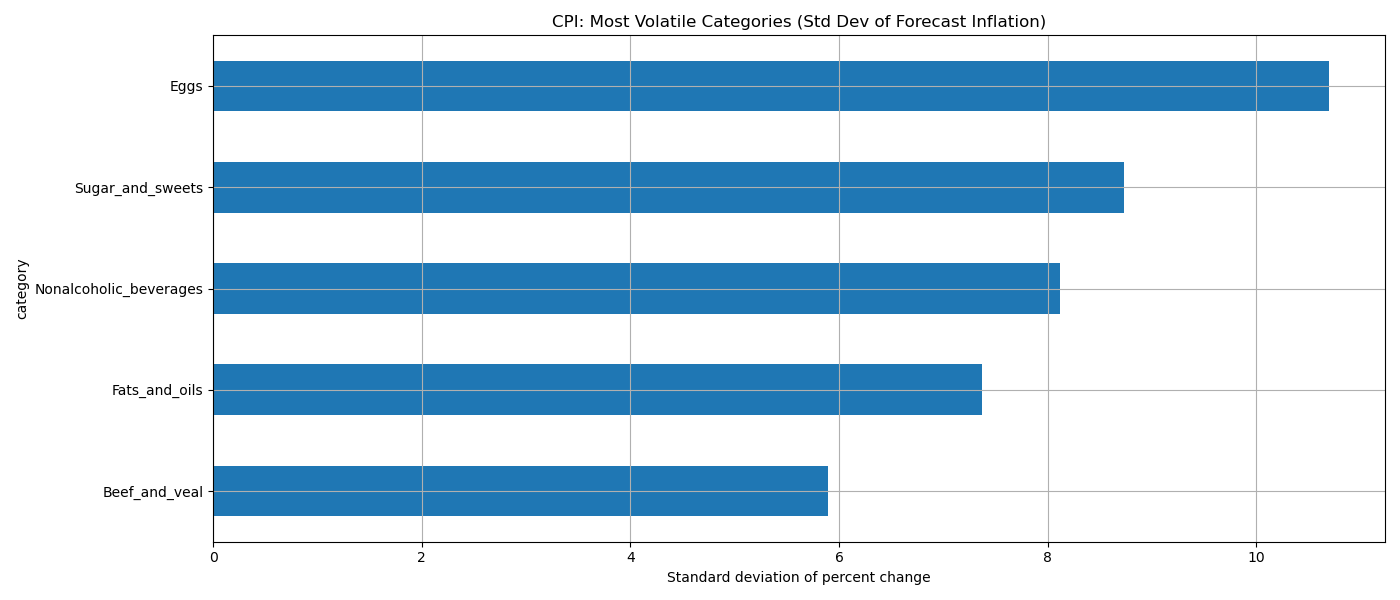
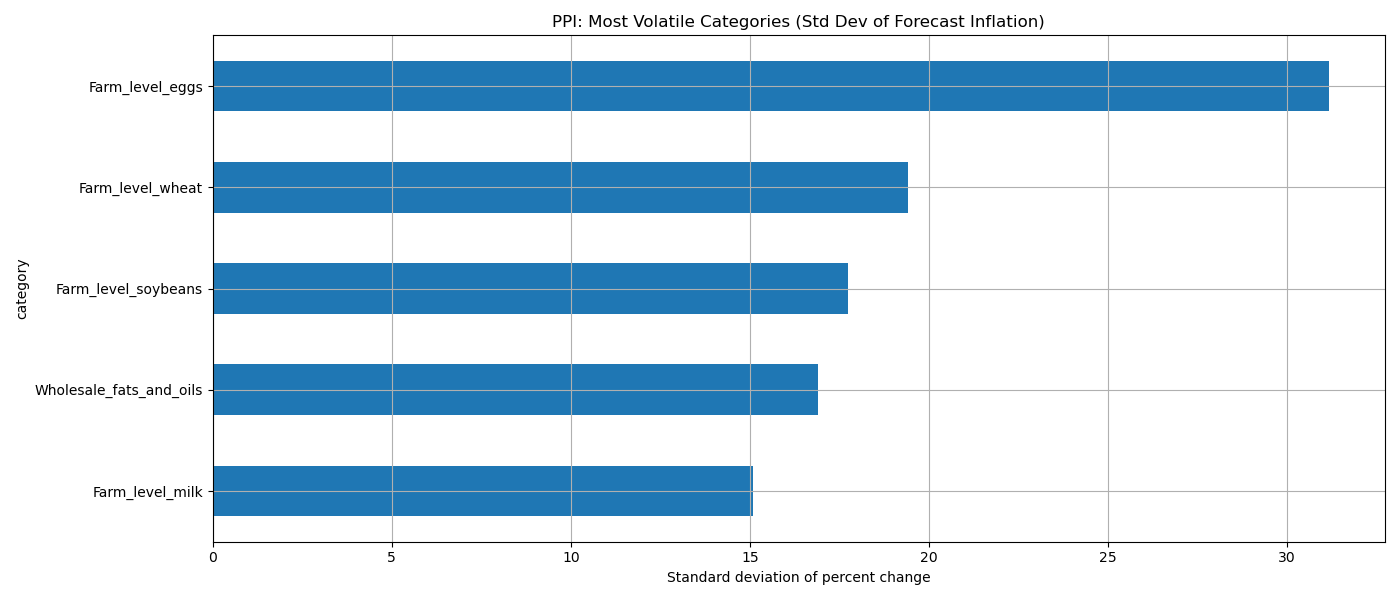
The above bar plots show that eggs are the most volatile category for both CPI and PPI, and fats and oils are the fourth most volatile for both, although the other categories differ across the two.
Volatility, Persistence, and CPI–PPI Linkages Beyond average inflation levels, volatility and persistence provide insight into how inflation shocks evolve over time. Rolling volatility measures show that food price instability clusters around major economic disruptions, particularly in the late 1970s and after COVID-19.
Comparing CPI and PPI volatility reveals strong co-movement between consumer and producer prices, with correlations above 0.8. This suggests that food price volatility is largely driven by common supply-side shocks rather than consumer-specific dynamics.
We also find that CPI food inflation is more persistent than PPI inflation. In other words, price increases faced by consumers tend to last longer than price changes at the producer level, pointing to frictions in price adjustment or pass-through along the supply chain.
Category-Level Inflation Dynamics Aggregate food inflation hides substantial differences across food categories. When we analyze major food groups separately, we find clear variation in inflation trends, volatility, and persistence.
Broken-stick regressions show that different categories experience trend changes at different times, reflecting differences in supply chains and exposure to shocks. Volatility analysis highlights fats and oils and meats as particularly unstable categories, while cereals and bakery products are relatively more stable.
Some categories experience volatility spikes at the same time, indicating broad system-wide shocks, while others display more category-specific behavior. Overall, these results show that food inflation risk varies meaningfully by category.
Healthy vs. Unhealthy Food Inflation
To assess whether healthier foods experience systematically higher inflation, we classify food categories into “healthy” (e.g., fruits, vegetables, dairy, meats) and “unhealthy or processed” (e.g., sugars, fats and oils, nonalcoholic beverages). Over the 1974–2022 period, unhealthy categories exhibit a higher average annual inflation rate (approximately 4.30%) than healthy categories (approximately 3.70%), a difference of about 0.61 percentage points. Unhealthy categories also display greater volatility, with a larger standard deviation of annual inflation rates. However, formal statistical tests do not detect a statistically significant difference in mean inflation between the two groups, and the estimated effect size is negligible. These findings suggest that while unhealthy foods have tended to inflate slightly faster, the long-run difference is modest relative to the overall variability in food inflation.
Fastest-Inflating Food Categories
Ranking categories by average annual inflation highlights additional heterogeneity. Over the full 1974–2024 period, CPI data show that sugar and sweets, fresh fruits, cereals and bakery products, and food away from home are among the fastest-inflating categories. In contrast, recent decades show a shift toward animal-based products such as beef and eggs. At the producer level, PPI data reveal even more pronounced inflation for farm-level eggs and certain agricultural inputs, particularly in the post-2000 period. Comparing CPI and PPI rankings suggests that upstream price pressures play a central role in shaping consumer food inflation, though the transmission varies by category.
Discussion
Taken together, our findings highlight three central themes. First, food inflation is strongly regime-dependent, with elevated levels and volatility during periods of macroeconomic stress. Second, food inflation dynamics are largely driven by supply-side forces, as evidenced by strong CPI–PPI co-movement and higher persistence at the consumer level. Third, substantial heterogeneity exists across food categories, implying that aggregate measures obscure important distributional and risk considerations. While unhealthy foods have experienced slightly higher average inflation, the difference is small relative to the overall variability of food prices. This suggests that concerns about food affordability during inflationary periods should focus not only on average price changes, but also on volatility, persistence, and category-specific exposure.
Conclusion
This project provides a comprehensive descriptive analysis of U.S. food inflation from 1974 to 2024. Food inflation exhibits clear regime-dependent behavior, substantial category-level heterogeneity, and strong links between producer and consumer price dynamics. Rather than evolving through sharp structural breaks, food inflation trends change gradually in response to long-run economic forces. These findings underscore the importance of considering both aggregate and disaggregated perspectives when evaluating food price inflation and its implications for consumers.
Author Contributions
Alistair Clark: Analyzed inflation differences between healthy and unhealthy food categories.
Emily Hsu: Conducted the analysis of the fastest-inflating food categories using CPI and PPI data.
Fiona Li: Analysis of food inflation across major economic periods.
Thomas Lee: Data preprocessing, ranking analyses, visualization, reproducibility tools.
All authors reviewed and approved the final manuscript.