Introduction
In this notebook, we will explore inflation patterns in the Historical Consumer Price Index (CPI) and Historical Producer Price Index (PPI) forecast series.
Both datasets contain annual percent-change forecasts from 1974–2024 for multiple food-related categories.
Specifically, we will examine:
Inflation trends over time via line plots
Cross-category comparisons using bar charts
The top 5 fastest-inflating categories
The most volatile categories, measured by standard deviation
These results will later be summarized in the main narrative notebook.
Imports and Load Data
import os
import pandas as pd
import matplotlib.pyplot as plt
import sys
sys.path.append('..')  # Just add the parent directory for utils
from utils.data_loader import load_inflation_data
from utils.transformers import reshape_to_long_format

plt.rcParams["figure.figsize"] = (14, 6)
plt.rcParams["axes.grid"] = True

# Load processed data
cpi, ppi = load_inflation_data()

display(cpi.head())
display(ppi.head())Tidy Long Formatting
cpi_long = reshape_to_long_format(cpi)
cpi_long.head()ppi_long = reshape_to_long_format(ppi)
ppi_long.head()Line plots of inflation over time
Line plots can show how forecast inflation changes year-to-year for each category.
By plotting all categories in each dataset, we will be able to visually inspect:
Long-run trends in food price forecasts
Periods of high inflation (e.g., 1970s, post-2020)
How different categories move together or diverge
We first start with CPI, then repeat for PPI.
CPI Line Plot:
fig, ax = plt.subplots()

for cat, df_cat in cpi_long.groupby("category"):
    ax.plot(
        df_cat["Year"],
        df_cat["pct_change"],
        alpha=0.4,
        label=cat
    )

ax.set_title("CPI Forecast: Annual Percent Change by Category (1974–2024)")
ax.set_xlabel("Year")
ax.set_ylabel("Percent change")

ax.legend(
    title="Category",
    bbox_to_anchor=(1.02, 1),
    loc="upper left"
)
plt.savefig('../figures/cpi_annual_change_by_category.png')
plt.show()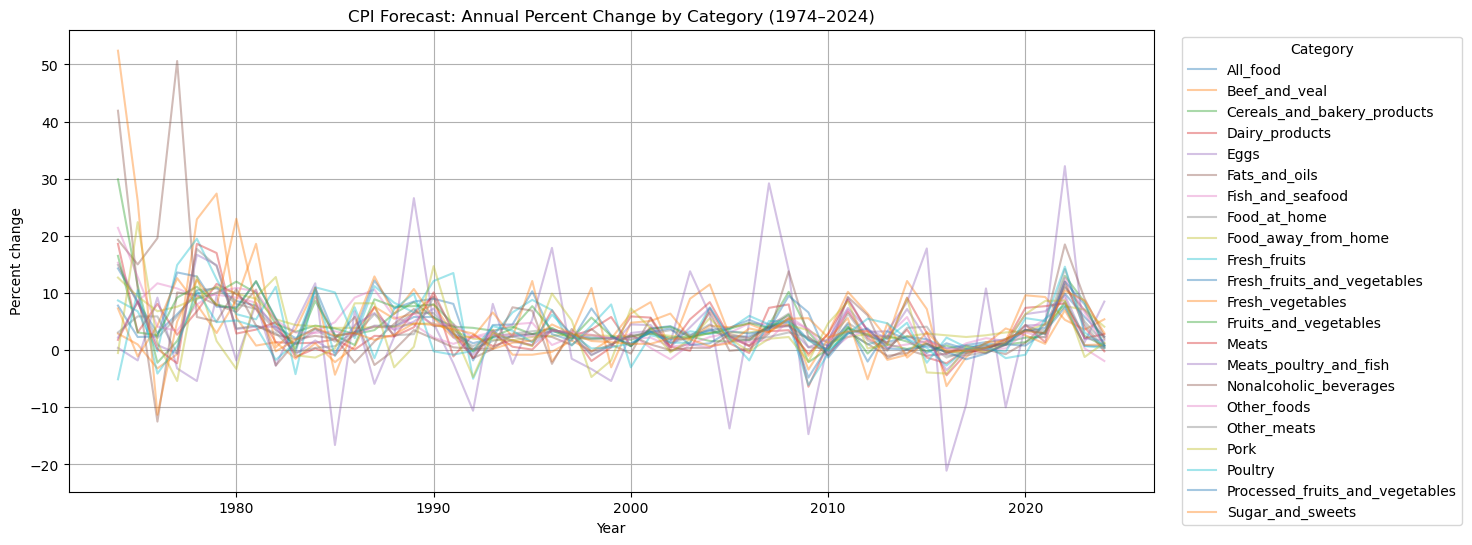
PPI Line Plot:
fig, ax = plt.subplots()

for cat, df_cat in ppi_long.groupby("category"):
    ax.plot(
        df_cat["Year"],
        df_cat["pct_change"],
        alpha=0.4,
        label=cat
    )

ax.set_title("PPI Forecast: Annual Percent Change by Category (1974–2024)")
ax.set_xlabel("Year")
ax.set_ylabel("Percent change")

ax.legend(
    title="Category",
    bbox_to_anchor=(1.02, 1),
    loc="upper left"
)
plt.savefig('../figures/ppi_annual_change_by_category.png')
plt.show()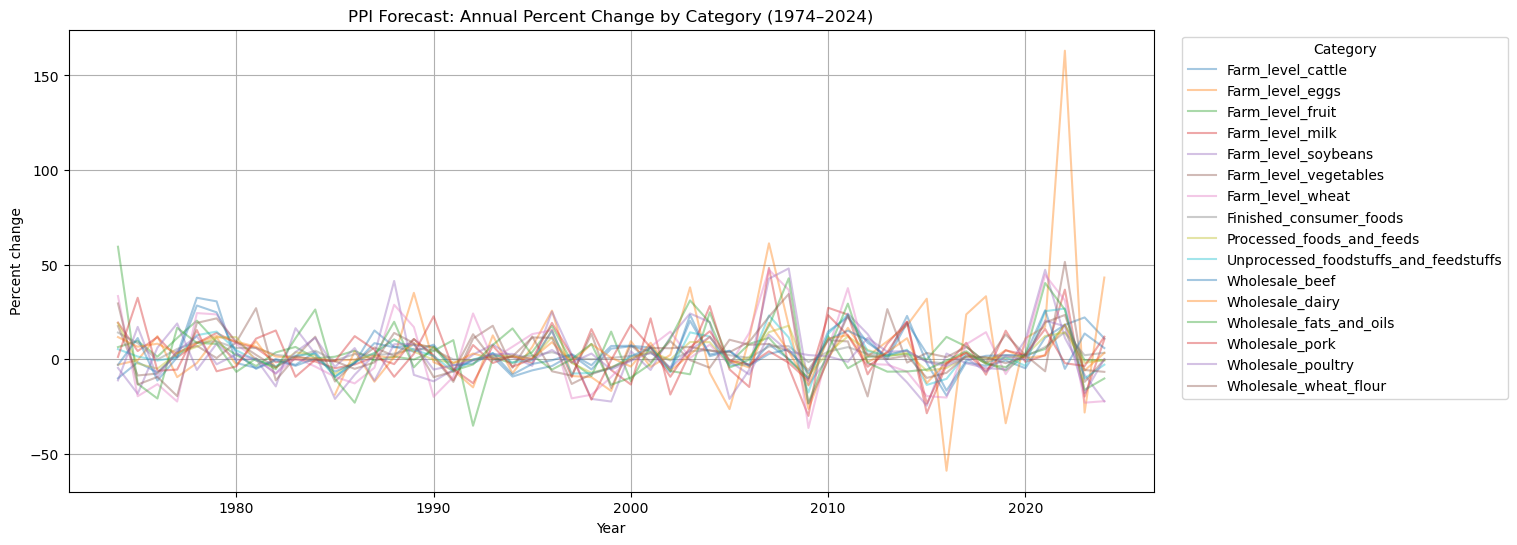
Bar charts comparing categories
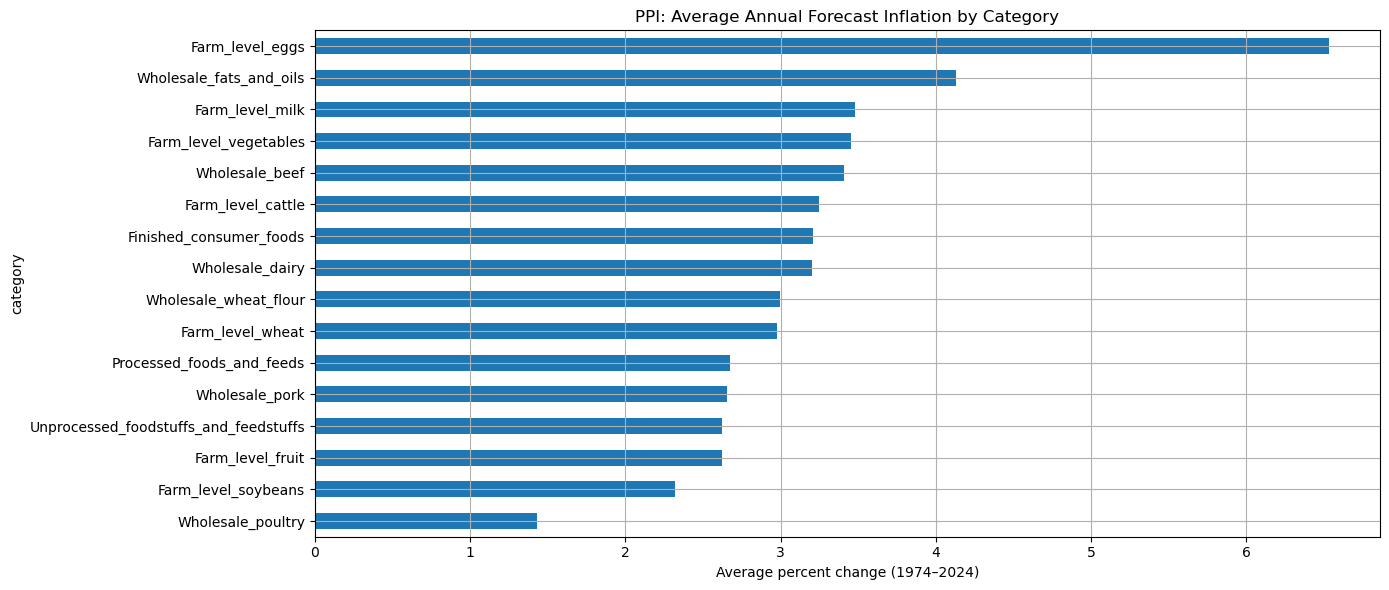
To compare categories more directly, we will now collapse the time dimension and compute the average annual percent change for each category.
This will give us a single summary number for each category, which we visualize with bar charts. Higher means indicate categories that, on average, are forecasted to inflate more quickly.
1. Compute mean inflation per category
cpi_mean = (
    cpi_long
    .groupby("category")["pct_change"]
    .mean()
    .sort_values(ascending=False)
)

display(cpi_mean)

ppi_mean = (
    ppi_long
    .groupby("category")["pct_change"]
    .mean()
    .sort_values(ascending=False)
)

display(ppi_mean)
category
Sugar_and_sweets 4.588235
Fresh_fruits 4.576471
Cereals_and_bakery_products 4.321569
Food_away_from_home 4.278431
Fresh_fruits_and_vegetables 4.268627
Fish_and_seafood 4.250980
Nonalcoholic_beverages 4.239216
Beef_and_veal 4.078431
Fruits_and_vegetables 4.076471
Fresh_vegetables 4.072549
Fats_and_oils 4.060784
All_food 3.882353
Other_foods 3.864706
Food_at_home 3.682353
Meats 3.519608
Meats_poultry_and_fish 3.458824
Dairy_products 3.390196
Other_meats 3.270588
Eggs 3.225490
Pork 3.009804
Poultry 2.849020
Processed_fruits_and_vegetables 2.723077
Name: pct_change, dtype: float64category
Farm_level_eggs 6.534694
Wholesale_fats_and_oils 4.131373
Farm_level_milk 3.476471
Farm_level_vegetables 3.450980
Wholesale_beef 3.409804
Farm_level_cattle 3.247059
Finished_consumer_foods 3.207843
Wholesale_dairy 3.200000
Wholesale_wheat_flour 2.996078
Farm_level_wheat 2.978431
Processed_foods_and_feeds 2.672549
Wholesale_pork 2.654902
Unprocessed_foodstuffs_and_feedstuffs 2.623529
Farm_level_fruit 2.621569
Farm_level_soybeans 2.317647
Wholesale_poultry 1.429412
Name: pct_change, dtype: float642. Bar charts of all categories
# CPI:
cpi_mean.plot(kind="barh")
plt.gca().invert_yaxis() # top to bottom
plt.title("CPI: Average Annual Forecast Inflation by Category")
plt.xlabel("Average percent change (1974–2024)")
plt.tight_layout()
plt.savefig('../figures/cpi_avg_annual_change_by_category.png')
plt.show()

# PPI:
ppi_mean.plot(kind="barh")
plt.gca().invert_yaxis() # top to bottom
plt.title("PPI: Average Annual Forecast Inflation by Category")
plt.xlabel("Average percent change (1974–2024)")
plt.tight_layout()
plt.savefig('../figures/ppi_avg_annual_change_by_category.png')
plt.show()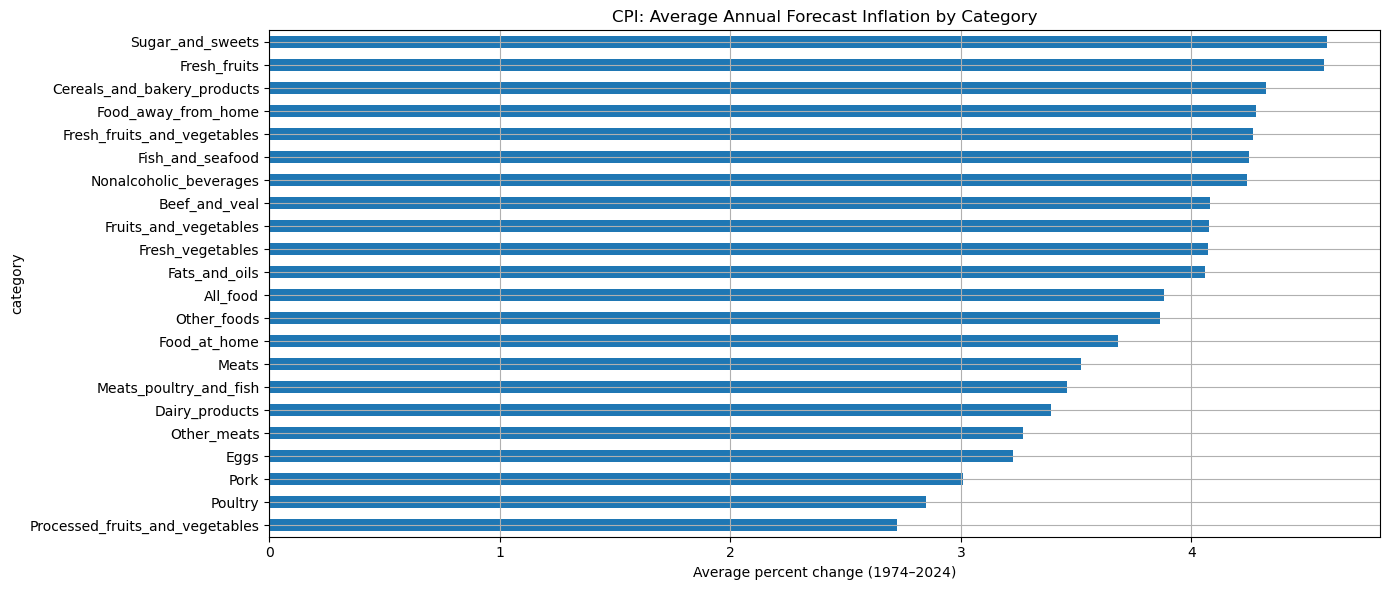
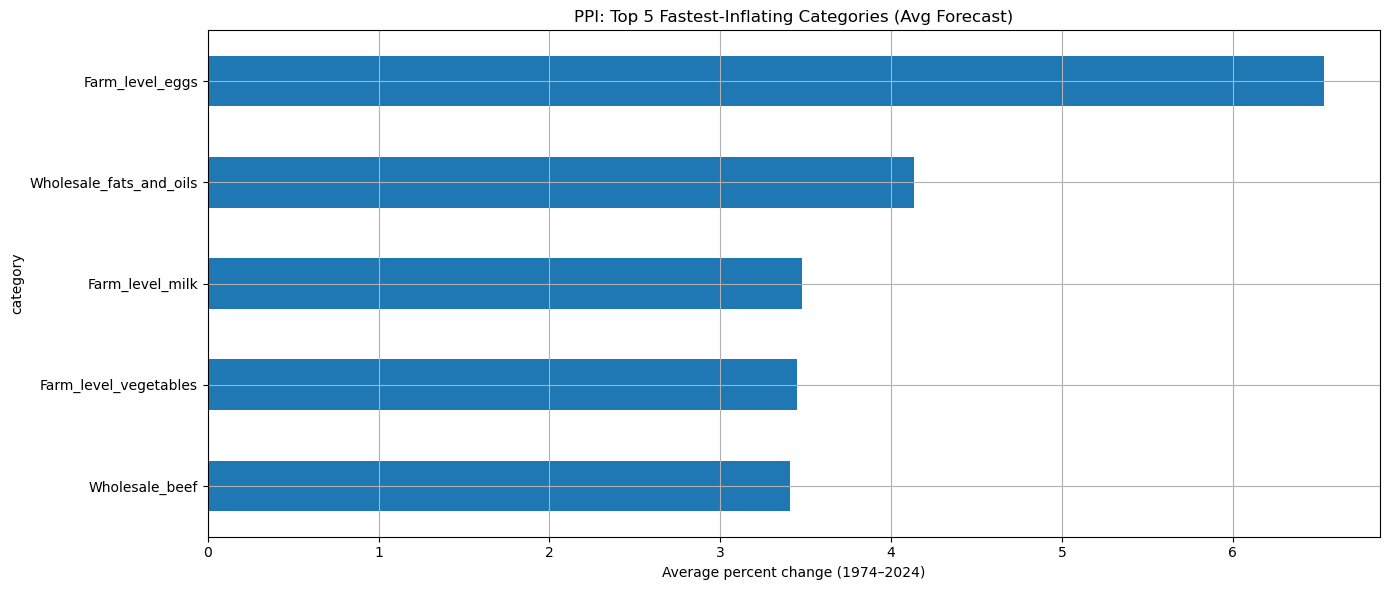
Top 5 fastest-inflating categories
Next, we explicitly rank categories by their average annual forecast inflation and highlight the top 5 for each dataset.
These categories represent the food items with the most persistent upward price pressure in the forecast data.
Extract top 5
cpi_top5 = cpi_mean.head(5)
ppi_top5 = ppi_mean.head(5)

display(cpi_top5)
display(ppi_top5)
category
Sugar_and_sweets 4.588235
Fresh_fruits 4.576471
Cereals_and_bakery_products 4.321569
Food_away_from_home 4.278431
Fresh_fruits_and_vegetables 4.268627
Name: pct_change, dtype: float64category
Farm_level_eggs 6.534694
Wholesale_fats_and_oils 4.131373
Farm_level_milk 3.476471
Farm_level_vegetables 3.450980
Wholesale_beef 3.409804
Name: pct_change, dtype: float64Plot top 5 (CPI & PPI)
# CPI:
cpi_top5.plot(kind="barh")
plt.gca().invert_yaxis() # top to bottom
plt.title("CPI: Top 5 Fastest-Inflating Categories (Avg Forecast)")
plt.xlabel("Average percent change (1974–2024)")
plt.tight_layout()
plt.savefig('../figures/cpi_top_5_fastest_inflating_categories.png')
plt.show()

# PPI:
ppi_top5.plot(kind="barh")
plt.gca().invert_yaxis() # top to bottom
plt.title("PPI: Top 5 Fastest-Inflating Categories (Avg Forecast)")
plt.xlabel("Average percent change (1974–2024)")
plt.tight_layout()
plt.savefig('../figures/ppi_top_5_fastest_inflating_categories.png')
plt.show()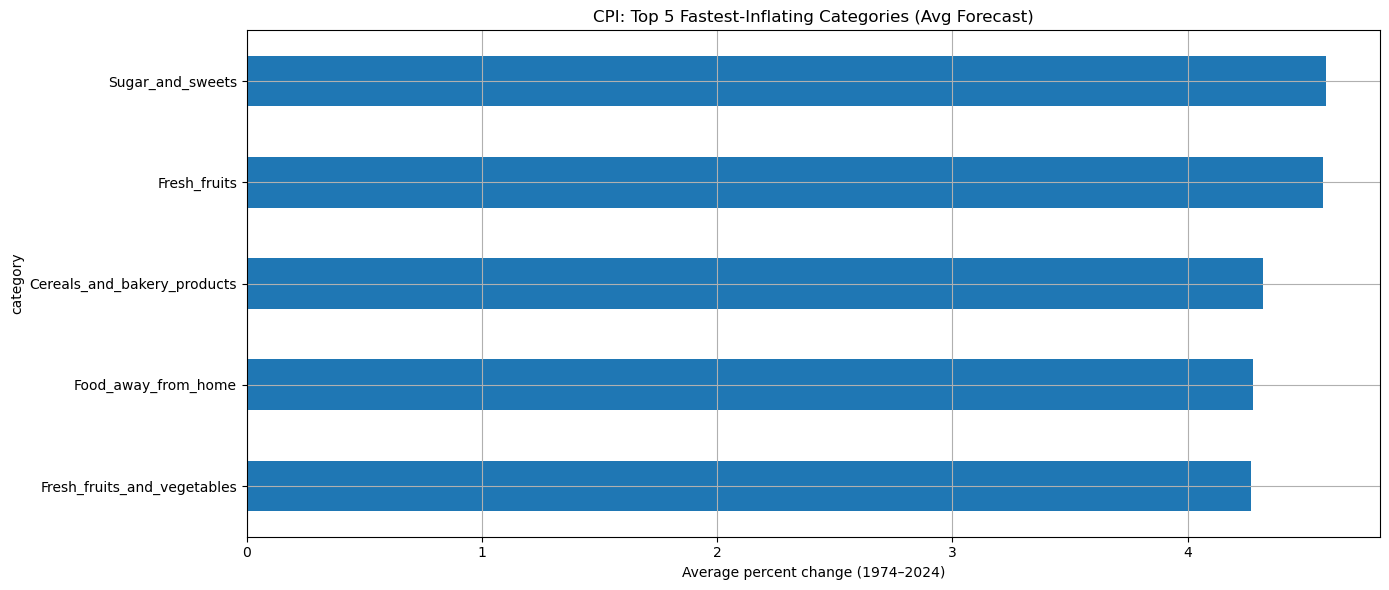
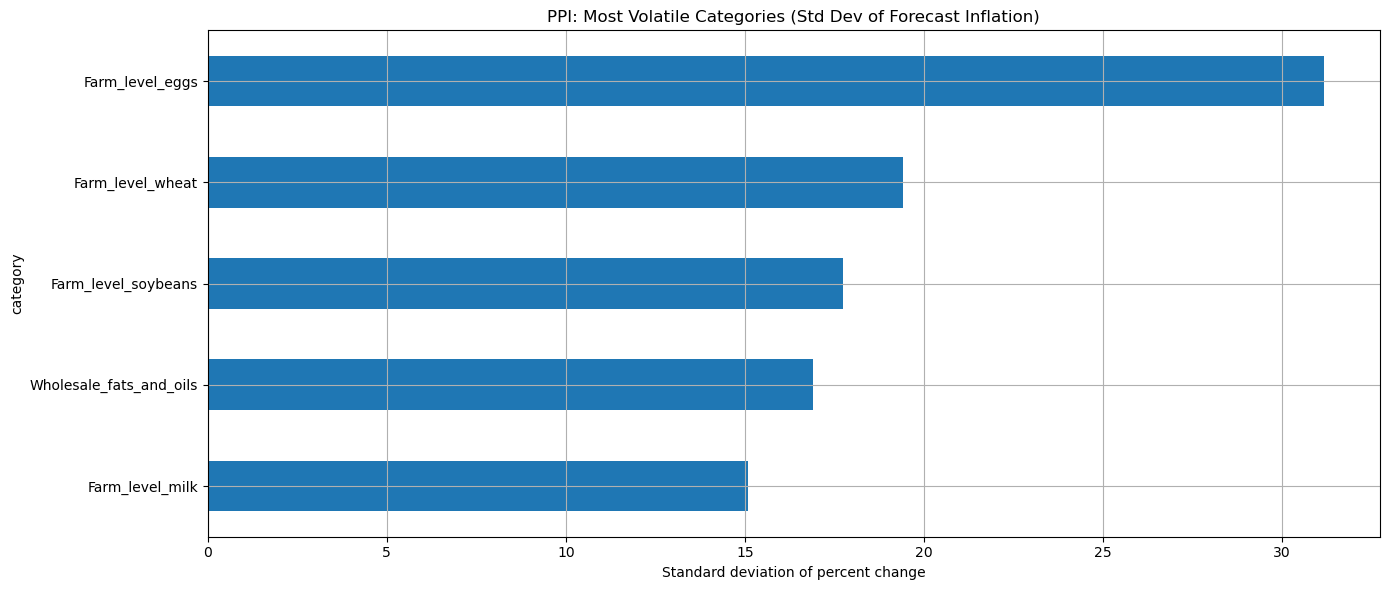
Most volatile categories (year-to-year)
To measure how unstable inflation forecasts are, we will look at the standard deviation of the annual percent change for each category:
A higher standard deviation means the category’s inflation forecast fluctuates more from year to year (higher volatility).
Compute volatility per category
cpi_vol = (
    cpi_long
    .groupby("category")["pct_change"]
    .std()
    .sort_values(ascending=False)
)

ppi_vol = (
    ppi_long
    .groupby("category")["pct_change"]
    .std()
    .sort_values(ascending=False)
)

display(cpi_vol)
display(ppi_vol)
category
Eggs 10.696875
Sugar_and_sweets 8.731842
Nonalcoholic_beverages 8.114507
Fats_and_oils 7.371705
Beef_and_veal 5.891666
Pork 5.629574
Fresh_fruits 5.314719
Cereals_and_bakery_products 5.037909
Fresh_vegetables 4.717079
Meats 4.407041
Dairy_products 4.298477
Fresh_fruits_and_vegetables 4.078014
Other_foods 4.033501
Poultry 4.014343
Other_meats 3.773502
Fish_and_seafood 3.756827
Fruits_and_vegetables 3.730769
Meats_poultry_and_fish 3.722804
Processed_fruits_and_vegetables 3.258995
Food_at_home 3.232504
All_food 2.886500
Food_away_from_home 2.644263
Name: pct_change, dtype: float64category
Farm_level_eggs 31.169660
Farm_level_wheat 19.420044
Farm_level_soybeans 17.729610
Wholesale_fats_and_oils 16.889482
Farm_level_milk 15.097080
Farm_level_vegetables 12.094914
Wholesale_wheat_flour 12.071768
Wholesale_pork 11.294287
Farm_level_cattle 10.915628
Unprocessed_foodstuffs_and_feedstuffs 9.721823
Farm_level_fruit 9.421535
Wholesale_beef 9.167383
Wholesale_poultry 7.644143
Wholesale_dairy 6.664203
Processed_foods_and_feeds 6.581309
Finished_consumer_foods 3.545580
Name: pct_change, dtype: float64Plot most volatile categories (top 5)
# CPI:
cpi_vol.head(5).plot(kind="barh")
plt.gca().invert_yaxis() # top to bottom
plt.title("CPI: Most Volatile Categories (Std Dev of Forecast Inflation)")
plt.xlabel("Standard deviation of percent change")
plt.tight_layout()
plt.savefig('../figures/cpi_most_volatile_categories.png')
plt.show()

# PPI:
ppi_vol.head(5).plot(kind="barh")
plt.gca().invert_yaxis() # top to bottom
plt.title("PPI: Most Volatile Categories (Std Dev of Forecast Inflation)")
plt.xlabel("Standard deviation of percent change")
plt.tight_layout()
plt.savefig('../figures/ppi_most_volatile_categories.png')
plt.show()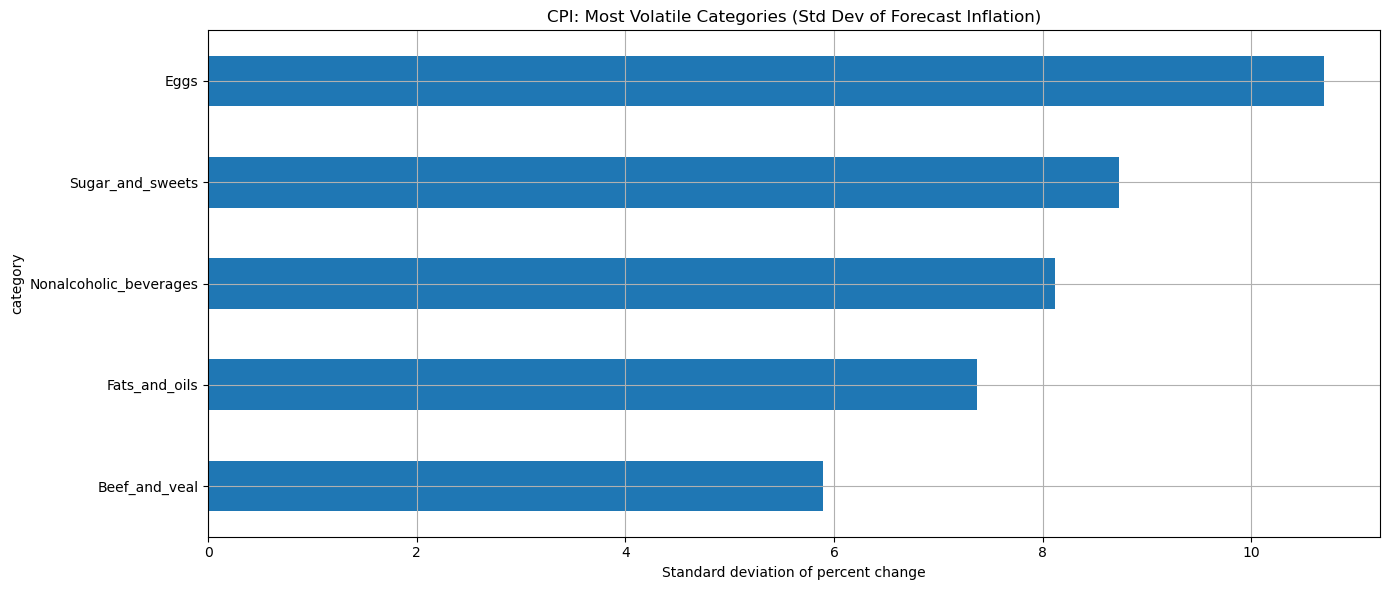
Saving Summary Tables for Later Use
# make a directory called eda_summary under ../outputs/
save_directory = "../outputs/eda_summary/"
os.makedirs(save_directory, exist_ok=True)

cpi_mean.to_csv(save_directory + "cpi_mean_inflation.csv")
cpi_vol.to_csv(save_directory + "cpi_volatility.csv")
ppi_mean.to_csv(save_directory + "ppi_mean_inflation.csv")
ppi_vol.to_csv(save_directory + "ppi_volatility.csv")