This notebook analyzes whether healthy food categories (fruits, vegetables, whole grains, dairy) experience more inflation than unhealthy/processed categories (sugars, snacks, fats & oils, processed foods) using USDA Consumer Price Index (CPI) data from 1974 to 2024.
0. Import libraries
import numpy as np
import pandas as pd
import matplotlib.pyplot as plt
import seaborn as sns
from scipy import stats
import sys
sys.path.append('..')  # Just add the parent directory for utils
from utils.data_loader import load_inflation_data

sns.set_style("whitegrid")
plt.rcParams['figure.figsize'] = (14, 6)
1. Load Data
cpi_df, _ = load_inflation_data()2. Data Cleaning and Preparation
df = cpi_df.copy()
df = df.fillna(np.nan)
df = df.dropna(how='all')

print(f"Shape: {df.shape}")
print(f"\nRemaining missing values:")
print(f"{df.isnull().sum()}")
Shape: (51, 23)
Remaining missing values:
Year 0
All_food 0
Beef_and_veal 0
Cereals_and_bakery_products 0
Dairy_products 0
Eggs 0
Fats_and_oils 0
Fish_and_seafood 0
Food_at_home 0
Food_away_from_home 0
Fresh_fruits 0
Fresh_fruits_and_vegetables 0
Fresh_vegetables 0
Fruits_and_vegetables 0
Meats 0
Meats_poultry_and_fish 0
Nonalcoholic_beverages 0
Other_foods 0
Other_meats 0
Pork 0
Poultry 0
Processed_fruits_and_vegetables 25
Sugar_and_sweets 0
dtype: int64
3. Classify Food Categories as Healthy vs Unhealthy
healthy_categories = [
    'Beef_and_veal',
    'Dairy_products',
    'Eggs',
    'Fish_and_seafood',
    'Fresh_fruits',
    'Fresh_fruits_and_vegetables',
    'Fresh_vegetables',
    'Fruits_and_vegetables',
    'Meats',
    'Meats_poultry_and_fish',
    'Other_meats',
    'Pork',
    'Poultry'
]
unhealthy_categories = [
    'Cereals_and_bakery_products',
    'Sugar_and_sweets',
    'Fats_and_oils',
    'Nonalcoholic_beverages'
]
4. Calculate Inflation Rates
df['Healthy_Avg_Inflation'] = df[healthy_categories].mean(axis=1)
df['Unhealthy_Avg_Inflation'] = df[unhealthy_categories].mean(axis=1)
inflation_summary = df[['Year', 'Healthy_Avg_Inflation', 'Unhealthy_Avg_Inflation']].copy()
for col in healthy_categories:
    inflation_summary[col] = df[col]
for col in unhealthy_categories:
    inflation_summary[col] = df[col]
for col in healthy_categories:
    plt.plot(inflation_summary['Year'], inflation_summary[col],
             color='green', alpha=0.6)
for col in unhealthy_categories:
    plt.plot(inflation_summary['Year'], inflation_summary[col],
             color='red', alpha=0.6)
plt.title('Inflation Rate: Healthy vs. Unhealthy Items')
plt.xlabel('Year')
plt.ylabel('Inflation Rate')
plt.tight_layout()
plt.savefig('../figures/inflation_healthy_vs_unhealthy.png')
plt.show()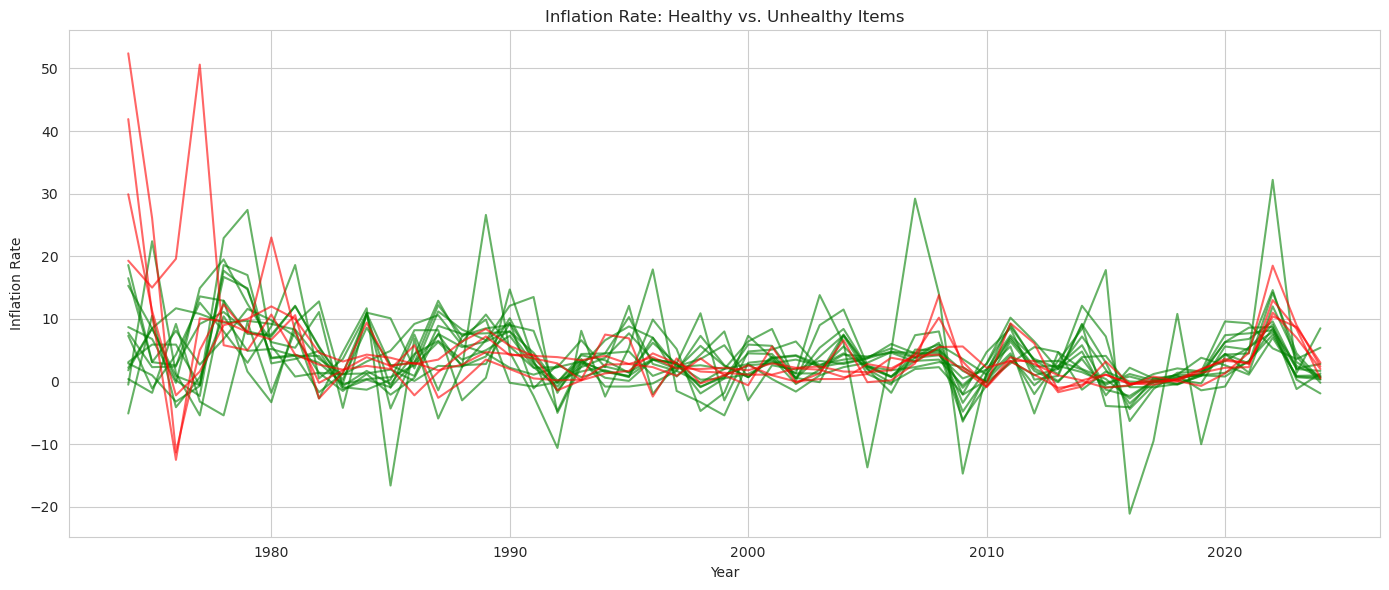
5. Compare Healthy vs Unhealthy Categories
healthy_inflation_rates = []
for col in healthy_categories:
    healthy_inflation_rates.extend(df[col].dropna().tolist())

unhealthy_inflation_rates = []
for col in unhealthy_categories:
    unhealthy_inflation_rates.extend(df[col].dropna().tolist())

print("SUMMARY STATISTICS: HEALTHY vs UNHEALTHY CATEGORIES")

summary_stats = pd.DataFrame({
    'Metric': ['Count', 'Mean (%)', 'Median (%)', 'Std Dev (%)', 'Min (%)', 'Max (%)', 'Q1 (%)', 'Q3 (%)'],
    'Healthy Categories': [
        len(healthy_inflation_rates),
        np.mean(healthy_inflation_rates),
        np.median(healthy_inflation_rates),
        np.std(healthy_inflation_rates),
        np.min(healthy_inflation_rates),
        np.max(healthy_inflation_rates),
        np.percentile(healthy_inflation_rates, 25),
        np.percentile(healthy_inflation_rates, 75)
    ],
    'Unhealthy Categories': [
        len(unhealthy_inflation_rates),
        np.mean(unhealthy_inflation_rates),
        np.median(unhealthy_inflation_rates),
        np.std(unhealthy_inflation_rates),
        np.min(unhealthy_inflation_rates),
        np.max(unhealthy_inflation_rates),
        np.percentile(unhealthy_inflation_rates, 25),
        np.percentile(unhealthy_inflation_rates, 75)
    ]
})

print(summary_stats.to_string(index=False))

print("DIFFERENCE (Healthy - Unhealthy)")
diff_mean = np.mean(healthy_inflation_rates) - np.mean(unhealthy_inflation_rates)
diff_median = np.median(healthy_inflation_rates) - np.median(unhealthy_inflation_rates)
print(f"Mean difference: {diff_mean:.2f}%")
print(f"Median difference: {diff_median:.2f}%")
SUMMARY STATISTICS: HEALTHY vs UNHEALTHY CATEGORIES
Metric Healthy Categories Unhealthy Categories
Count 663.000000 204.000000
Mean (%) 3.695928 4.302451
Median (%) 2.900000 2.700000
Std Dev (%) 5.223416 7.375771
Min (%) -21.100000 -12.500000
Max (%) 32.200000 52.400000
Q1 (%) 0.700000 1.000000
Q3 (%) 6.300000 4.775000
DIFFERENCE (Healthy - Unhealthy)
Mean difference: -0.61%
Median difference: 0.20%
year_comparison = df[['Year', 'Healthy_Avg_Inflation', 'Unhealthy_Avg_Inflation']].copy()
year_comparison['Difference (H-U)'] = year_comparison['Healthy_Avg_Inflation'] - year_comparison['Unhealthy_Avg_Inflation']
year_comparison.columns = ['Year', 'Healthy (%)', 'Unhealthy (%)', 'Difference (%)']

print("\nYear-by-Year Comparison (First 15 Years):")
print(year_comparison.head(15).to_string(index=False))

print("\nYear-by-Year Comparison (Last 15 Years):")
print(year_comparison.tail(15).to_string(index=False))
Year-by-Year Comparison (First 15 Years):
 Year  Healthy (%)  Unhealthy (%)  Difference (%)
 1974     6.076923         35.875      -29.798077
 1975     5.976923         15.775       -9.798077
 1976     3.007692         -1.600        4.607692
 1977     3.976923         16.825      -12.848077
 1978    12.423077          9.175        3.248077
 1979    10.946154          7.675        3.271154
 1980     5.000000         13.100       -8.100000
 1981     7.538462          8.225       -0.686538
 1982     3.800000          1.100        2.700000
 1983     0.230769          2.075       -1.844231
 1984     5.423077          5.025        0.398077
 1985    -0.169231          2.625       -2.794231
 1986     4.046154          2.350        1.696154
 1987     6.700000          1.050        5.650000
 1988     4.476923          3.425        1.051923

Year-by-Year Comparison (Last 15 Years):
 Year  Healthy (%)  Unhealthy (%)  Difference (%)
 2010     1.392308          0.050        1.342308
 2011     6.523077          4.925        1.598077
 2012     1.684615          3.325       -1.640385
 2013     2.246154         -0.775        3.021154
 2014     5.246154         -0.250        5.496154
 2015     2.076923          1.100        0.976923
 2016    -3.215385         -0.425       -2.790385
 2017    -0.753846          0.100       -0.853846
 2018     1.407692          0.225        1.182692
 2019     0.207692          1.150       -0.942308
 2020     4.276923          2.600        1.676923
 2021     4.984615          3.175        1.809615
 2022    11.138462         13.225       -2.086538
 2023     1.900000          8.275       -6.375000
 2024     1.653846          1.975       -0.321154
6. Visualization of Inflation Trends
fig, ax = plt.subplots()

ax.plot(df['Year'], df['Healthy_Avg_Inflation'],
        label='Healthy Categories', color='green', alpha=0.7)
ax.plot(df['Year'], df['Unhealthy_Avg_Inflation'],
        label='Unhealthy/Processed Categories', color='red', alpha=0.7)

ax.axhline(y=0, color='black')
ax.set_xlabel('Year')
ax.set_ylabel('Inflation Rate (%)')
ax.set_title('Year-over-Year Inflation Rates: Healthy vs Unhealthy Food Categories (1974-2024)')
ax.legend()
plt.savefig('../figures/yoy_inflation_healthy_vs_unhealthy.png')
plt.show()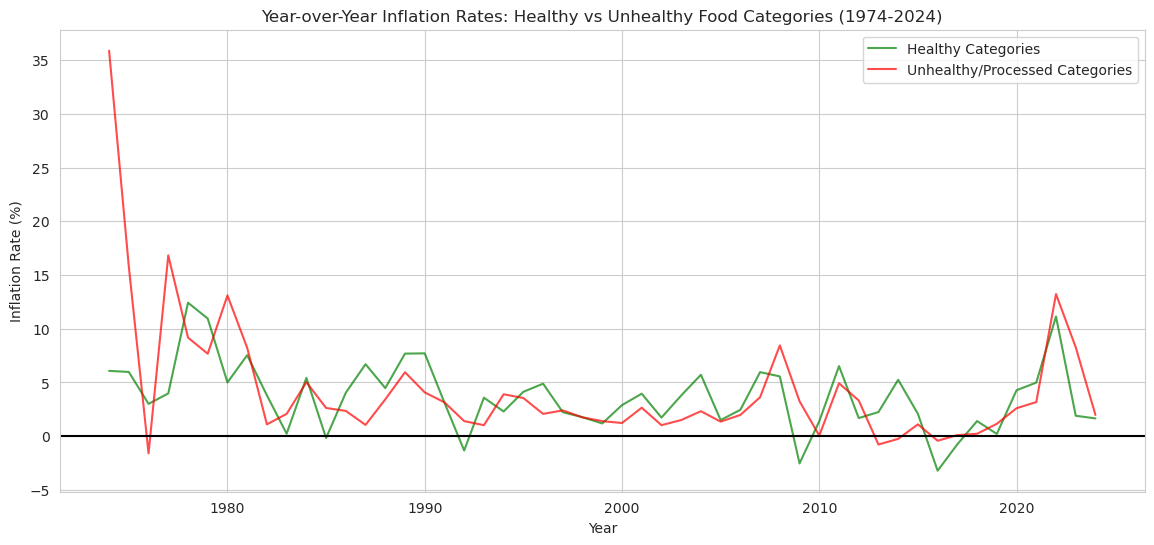
fig, ax = plt.subplots()

sns.boxplot(data=[healthy_inflation_rates, unhealthy_inflation_rates],
            palette=['green', 'red'])

plt.xticks([0, 1], ['Healthy Categories', 'Unhealthy Categories'])
plt.ylabel('Inflation Rate (%)')
plt.title('Distribution of Inflation Rates')
plt.savefig('../figures/healthy_vs_unhealthy_inflation_boxplot.png')
plt.show()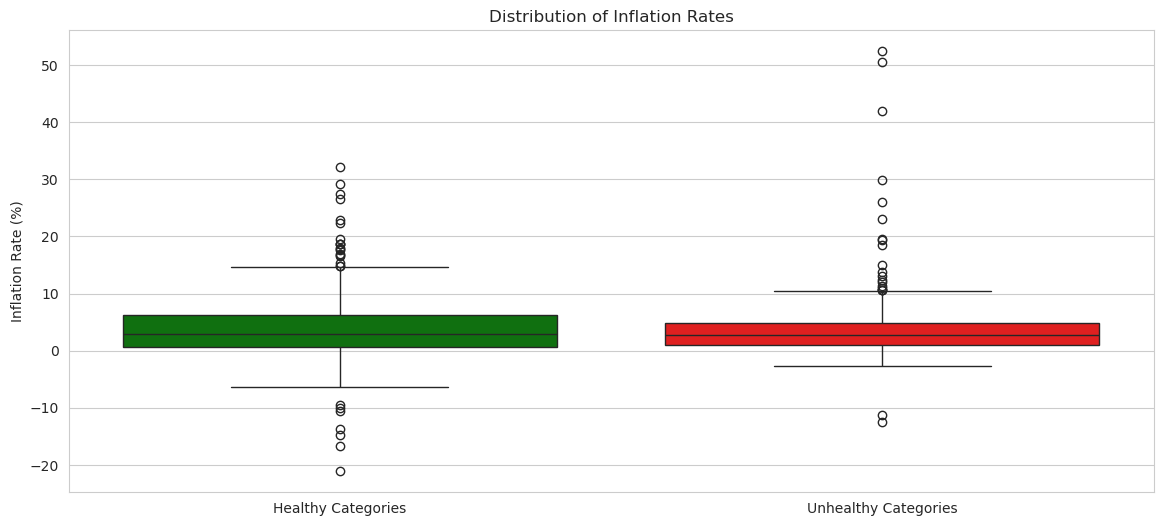
fig, axes = plt.subplots(1, 2)

axes[0].hist(healthy_inflation_rates, color='green', edgecolor='black', bins=30, density='True')
axes[0].set_xlabel('Inflation Rate (%)')
axes[0].set_ylabel('Frequency')
axes[0].set_title('Distribution: Healthy Categories')
axes[0].axvline(np.mean(healthy_inflation_rates), color='darkgreen', linestyle='--')

axes[1].hist(unhealthy_inflation_rates, color='red', edgecolor='black', bins=30, density='True')
axes[1].set_xlabel('Inflation Rate (%)')
axes[1].set_ylabel('Frequency')
axes[1].set_title('Distribution: Unhealthy/Processed Categories')
axes[1].axvline(np.mean(unhealthy_inflation_rates), color='darkred', linestyle='--')

plt.tight_layout()
plt.savefig('../figures/healthy_vs_unhealthy_inflation_histogram.png')
plt.show()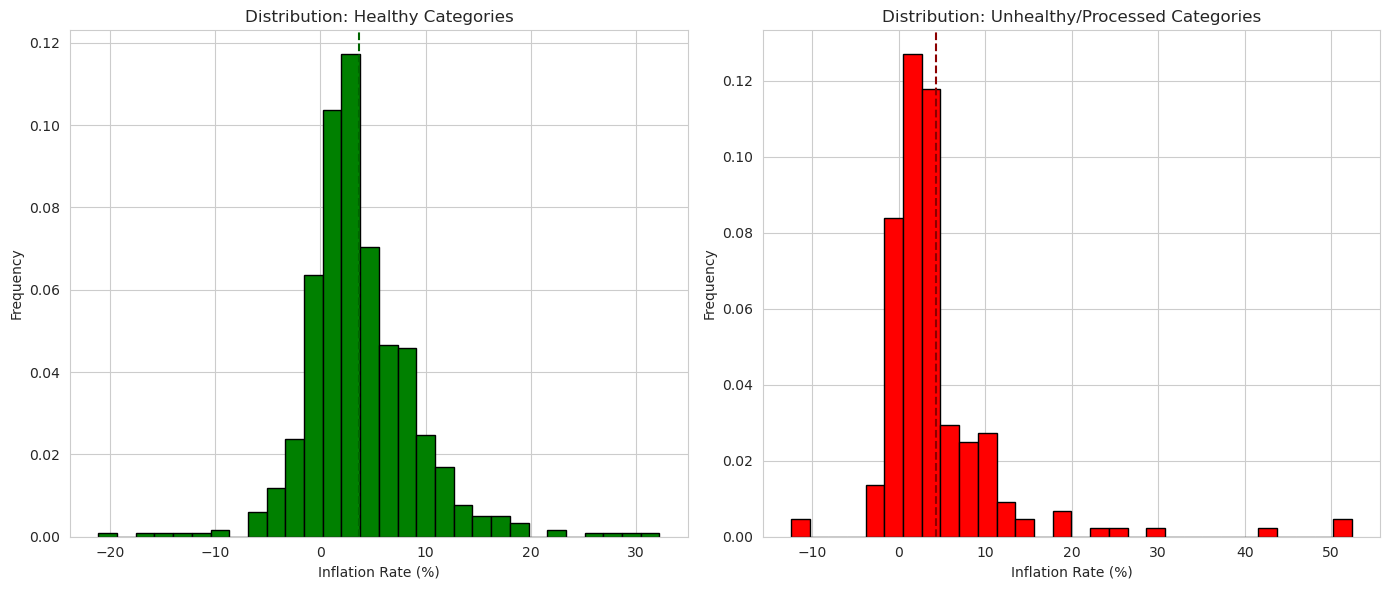
8. Statistical Analysis
print("STATISTICAL TEST 1: Independent Samples t-test")
print("Null Hypothesis (H0): There is no significant difference in mean")
print("inflation between healthy and unhealthy categories")
print("Alternative Hypothesis (H1): There is a significant difference\n")

t_stat, t_pvalue = stats.ttest_ind(healthy_inflation_rates, unhealthy_inflation_rates)
print(f"t-statistic: {t_stat:.4f}")
print(f"p-value: {t_pvalue:.6f}")
print(f"Result: FAIL TO REJECT the null hypothesis (p ≥ 0.05)")
print("Conclusion: There is NO statistically significant difference in inflation")
print("rates between healthy and unhealthy food categories.")

print(f"\nEFFECT SIZE: Cohen's d")
n1, n2 = len(healthy_inflation_rates), len(unhealthy_inflation_rates)
var1, var2 = np.var(healthy_inflation_rates, ddof=1), np.var(unhealthy_inflation_rates, ddof=1)
pooled_std = np.sqrt(((n1-1)*var1 + (n2-1)*var2) / (n1 + n2 - 2))
cohens_d = (np.mean(healthy_inflation_rates) - np.mean(unhealthy_inflation_rates)) / pooled_std

if abs(cohens_d) < 0.2:
    effect_interpretation = "negligible"
elif abs(cohens_d) < 0.5:
    effect_interpretation = "small"
elif abs(cohens_d) < 0.8:
    effect_interpretation = "medium"
else:
    effect_interpretation = "large"

print(f"Cohen's d: {cohens_d:.4f}")
print(f"Cohen's d effect size is {effect_interpretation}")
STATISTICAL TEST 1: Independent Samples t-test
Null Hypothesis (H0): There is no significant difference in mean
inflation between healthy and unhealthy categories
Alternative Hypothesis (H1): There is a significant difference
t-statistic: -1.3041
p-value: 0.192536
Result: FAIL TO REJECT the null hypothesis (p ≥ 0.05)
Conclusion: There is NO statistically significant difference in inflation
rates between healthy and unhealthy food categories.
EFFECT SIZE: Cohen's d
Cohen's d: -0.1044
Cohen's d effect size is negligible
print("STATISTICAL TEST 2: Mann-Whitney U Test (Non-parametric)")
print("This test doesn't assume normal distribution of data\n")

u_stat, u_pvalue = stats.mannwhitneyu(healthy_inflation_rates, unhealthy_inflation_rates)
print(f"U-statistic: {u_stat:.4f}")
print(f"p-value: {u_pvalue:.6f}")

print(f"Result: FAIL TO REJECT the null hypothesis (p ≥ 0.05)")
print("Conclusion: There is NO statistically significant difference in inflation")
print("distributions between healthy and unhealthy categories.")
STATISTICAL TEST 2: Mann-Whitney U Test (Non-parametric)
This test doesn't assume normal distribution of data
U-statistic: 68902.0000
p-value: 0.683412
Result: FAIL TO REJECT the null hypothesis (p ≥ 0.05)
Conclusion: There is NO statistically significant difference in inflation
distributions between healthy and unhealthy categories.
print("CONFIDENCE INTERVALS (95%)")

healthy_mean = np.mean(healthy_inflation_rates)
healthy_sem = stats.sem(healthy_inflation_rates)
healthy_ci = stats.t.interval(0.95, len(healthy_inflation_rates)-1, loc=healthy_mean, scale=healthy_sem)

print("Healthy Categories:")
print(f"  Mean: {healthy_mean:.4f}%")
print(f"  95% CI: [{healthy_ci[0]:.4f}%, {healthy_ci[1]:.4f}%]")

unhealthy_mean = np.mean(unhealthy_inflation_rates)
unhealthy_sem = stats.sem(unhealthy_inflation_rates)
unhealthy_ci = stats.t.interval(0.95, len(unhealthy_inflation_rates)-1, loc=unhealthy_mean, scale=unhealthy_sem)

print(f"\nUnhealthy/Processed Categories:")
print(f"  Mean: {unhealthy_mean:.4f}%")
print(f"  95% CI: [{unhealthy_ci[0]:.4f}%, {unhealthy_ci[1]:.4f}%]")

print(f"\nDifference (Healthy - Unhealthy): {healthy_mean - unhealthy_mean:.4f}%")
CONFIDENCE INTERVALS (95%)
Healthy Categories:
Mean: 3.6959%
95% CI: [3.2973%, 4.0946%]
Unhealthy/Processed Categories:
Mean: 4.3025%
95% CI: [3.2817%, 5.3232%]
Difference (Healthy - Unhealthy): -0.6065%
9. Key Findings and Conclusion
print("SUMMARY OF FINDINGS")

healthy_mean = np.mean(healthy_inflation_rates)
unhealthy_mean = np.mean(unhealthy_inflation_rates)
difference = healthy_mean - unhealthy_mean

print(f"\n1. AVERAGE INFLATION RATES (1974-2022):")
print(f"   - Healthy Categories: {healthy_mean:.2f}%")
print(f"   - Unhealthy/Processed Categories: {unhealthy_mean:.2f}%")
print(f"   - Difference: {difference:.2f}%")
print(f"   - Unhealthy/processed categories experienced HIGHER inflation")

print(f"\n2. VARIABILITY (Standard Deviation):")
print(f"   - Healthy Categories: {np.std(healthy_inflation_rates):.2f}%")
print(f"   - Unhealthy/Processed Categories: {np.std(unhealthy_inflation_rates):.2f}%")

print(f"\n3. STATISTICAL SIGNIFICANCE:")
print(f"   - t-test p-value: {t_pvalue:.6f} (p ≥ 0.05)")
print(f"   - Result: The difference is NOT statistically significant")

print(f"\n4. EFFECT SIZE:")
print(f"   - Cohen's d: {cohens_d:.4f} ({effect_interpretation} effect)")

print("CONCLUSION")
print(f"""
Based on the analysis of USDA Consumer Price Index (CPI) data from 1974-2022:

The data shows that over the nearly 50-year period, HEALTHY food categories
(fruits, vegetables, dairy, cereals) have experienced {abs(difference):.2f}%
LOWER average inflation compared to unhealthy/processed
categories (sugars, fats & oils, processed foods).

Statistical Testing Results:
- The t-test p-value of {t_pvalue:.6f} indicates that the difference is
  NOT statistically significant.

- The effect size (Cohen's d = {cohens_d:.4f}) is negligible.

This suggests that unhealthy food prices have inflated more rapidly than
processed/unhealthy food prices over the study period, which has important
implications for food affordability and dietary choices.
""")
SUMMARY OF FINDINGS
1. AVERAGE INFLATION RATES (1974-2022):
- Healthy Categories: 3.70%
- Unhealthy/Processed Categories: 4.30%
- Difference: -0.61%
- Unhealthy/processed categories experienced HIGHER inflation
2. VARIABILITY (Standard Deviation):
- Healthy Categories: 5.22%
- Unhealthy/Processed Categories: 7.38%
3. STATISTICAL SIGNIFICANCE:
- t-test p-value: 0.192536 (p ≥ 0.05)
- Result: The difference is NOT statistically significant
4. EFFECT SIZE:
- Cohen's d: -0.1044 (negligible effect)
CONCLUSION
Based on the analysis of USDA Consumer Price Index (CPI) data from 1974-2022:
The data shows that over the nearly 50-year period, HEALTHY food categories
(fruits, vegetables, dairy, cereals) have experienced 0.61%
LOWER average inflation compared to unhealthy/processed
categories (sugars, fats & oils, processed foods).
Statistical Testing Results:
- The t-test p-value of 0.192536 indicates that the difference is
NOT statistically significant.
- The effect size (Cohen's d = -0.1044) is negligible.
This suggests that unhealthy food prices have inflated more rapidly than
processed/unhealthy food prices over the study period, which has important
implications for food affordability and dietary choices.