Part 2: How has the tone of inaugural addresses changed over time?
Answered by these subquestions:
Has there been more fearmongering or polarizing speech over time?
Which president has the most polarizing speech?
Packages
import pandas as pd
import numpy as np
import matplotlib.pyplot as plt
import seaborn as sns
from collections import Counter
from afinn import Afinn
import spacy
Loading Data
from make_data import write_inaugural_addresses
write_inaugural_addresses(n_speeches=55)
data = pd.read_csv("data/inaugural_address.csv")
data = data.drop(data.columns[0], axis=1)
data["word count"] = data["text"].str.split().str.len()
data["character count"] = data["text"].str.len()
data["year"] = data["date"].str[:4]
data['date'] = pd.to_datetime(data['date'])
# fixing Trump's label in the dataset
data.iloc[52, 0] = "Donald J. Trump"
data.iloc[54, 0] = "Donald J. Trump"# Showing first rows of data
data.head()Has there been more fearmongering or polarizing speech over time?
Here polarizing speech is defined with a lexicon of negative words and fearmongering is defined as ‘us vs them’ rhetoric.
Polarizing speech over time:
afinn = Afinn()

data["sentiment_score"] = data["text"].apply(afinn.score)

# Normalize by speech length
data["sentiment_per_word"] = data["sentiment_score"] / data["word count"]
# Plotting overall sentiment over time
x = range(len(data))
plt.figure()
plt.scatter(x, data["sentiment_per_word"])
plt.plot(
x,
data["sentiment_per_word"].rolling(5, center=True).mean()
)
plt.xlabel("President")
plt.ylabel("Sentiment per word")
plt.title("Sentiment in Inaugural Addresses Over Time")
# showing only every 3rd president for the sake of space
plt.xticks(
ticks=x[::3],
labels=data["president_name"].iloc[::3],
rotation=45,
ha="right"
)
plt.tight_layout()
plt.show()
# Downward trend shows more negative or fear oriented language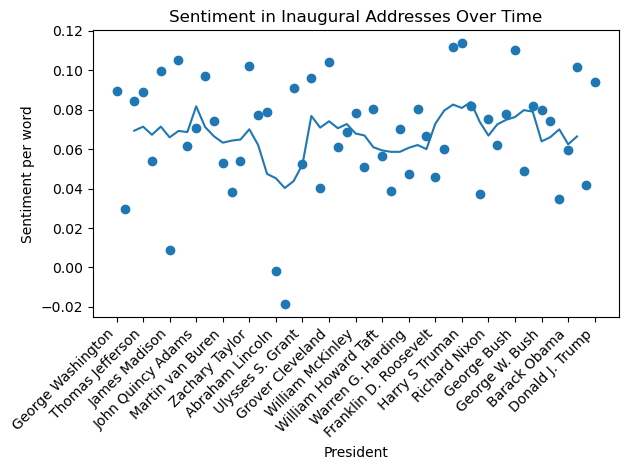
Defining a concrete lexicon of polarizing words:
polarizing_words = {
    "fear", "danger", "threat", "enemy", "crisis", "violence",
    "terror", "war", "risk", "uncertainty", "destruction",
    "attack", "harm", "conflict"
}
def polarizing_word_rate(text):
words = text.lower().split()
return sum(word in polarizing_words for word in words) / len(words)
data["polarizing_rate"] = data["text"].apply(polarizing_word_rate)# Plotting fear language (polarization) over time
plt.figure()
plt.scatter(data["year"], data["polarizing_rate"])
plt.plot(
data["year"],
data["polarizing_rate"].rolling(5, center=True).mean()
)
plt.xlabel("Year")
plt.ylabel("Polarizing words (rate)")
plt.title("Polarizing Language Over Time")
# showing only every 3rd president for the sake of space
plt.xticks(x[::3],rotation=45)
plt.show()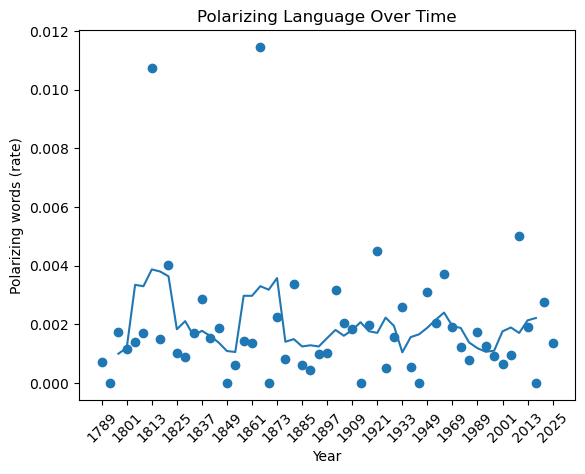
Fearmongering:
This often shows up as ingroup vs outgroup framing, so we use ‘us vs them’ rhetoric to measure it.
ingroup = {"we", "us", "our", "ours"}
outgroup = {"they", "them", "their", "theirs"}
def fear_score(text):
words = text.lower().split()
in_count = sum(word in ingroup for word in words)
out_count = sum(word in outgroup for word in words)
return (in_count + out_count) / len(words)
data["fearmongering_rate"] = data["text"].apply(fear_score)plt.figure()
plt.scatter(data["year"], data["fearmongering_rate"])
plt.plot(
data["year"],
data["fearmongering_rate"].rolling(5, center=True).mean()
)
plt.xlabel("Year")
plt.ylabel("Ingroup/Outgroup language rate")
plt.title("Fearmongering Language Over Time")
plt.xticks(x[::3], rotation=45)
plt.show()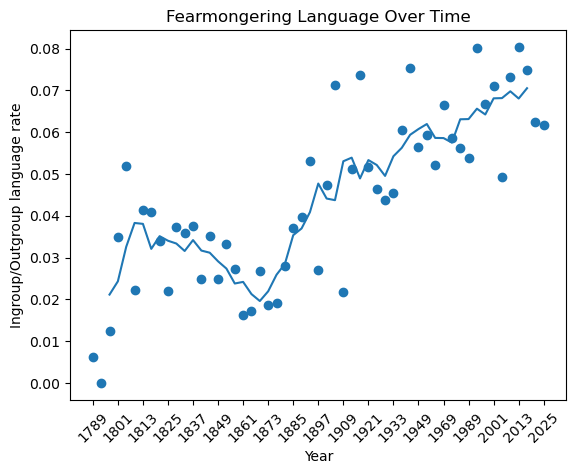
It is clear from these graphs that, although inaugural speeches have not become significantly more negative in their sentiment over the centuries, there is an evident shift in fearmongering language. A distinct dip was shown in fearmongering (‘us vs them’ rhetoric) around Abraham Lincoln’s presidency and the Civil War, but since then has steadily increased, with the highest levels being seen during Barack Obama’s presidency.
Which president has the most polarizing speech and which has shown most fearmongering?
Since some presidents appear multiple times (having multiple inaugurals), we average by president:
# most polarizing speech (speeches with most negative sentiment)
top_polarizing_speeches = (
    data[["president_name", "year", "polarizing_rate"]]
    .sort_values("polarizing_rate", ascending=False)
)

second_most_polarizing_speech = top_polarizing_speeches.iloc[0]
second_most_polarizing_speech
president_name Abraham Lincoln
year 1865
polarizing_rate 0.011461
Name: 19, dtype: object# 2nd most polarizing speech
top_polarizing_speeches = (
data[["president_name", "year", "polarizing_rate"]]
.sort_values("polarizing_rate", ascending=False)
)
second_most_polarizing_speech = top_polarizing_speeches.iloc[1]
second_most_polarizing_speechpresident_name James Madison
year 1813
polarizing_rate 0.010744
Name: 6, dtype: object# most fearmongering speech (speeches with most 'us vs them' rhetoric)
top_fearmongering_speeches = (
data[["president_name", "year", "fearmongering_rate"]]
.sort_values("fearmongering_rate", ascending=False)
)
most_fearmongering_speech = top_fearmongering_speeches.iloc[0]
most_fearmongering_speechpresident_name Barack Obama
year 2013
fearmongering_rate 0.080383
Name: 51, dtype: object# Second most fearmongering speech
second_most_fearmongering_speech = top_fearmongering_speeches.iloc[1]
second_most_fearmongering_speechpresident_name William J. Clinton
year 1993
fearmongering_rate 0.0801
Name: 46, dtype: objectSummary Table by Era:
data["year"] = data["year"].astype(int)data["era"] = pd.cut(
data["year"],
bins=[1780, 1850, 1900, 1950, 2000, 2030],
labels=["Early", "19th c.", "Early 20th", "Cold War", "Modern"]
)
data.groupby("era")[["sentiment_per_word", "fearmongering_rate", "polarizing_rate"]].mean()By this table, we can see that the lowest sentiment per word has been observed in the 19th century, the most fearmongering language has occurred in this modern era we are in now, and the most polarizing speech was observed during the cold war, with the modern era seeing a slight increase from that.
Though sentiment analysis shows that negative sentiment in inaugural addresses has mostly stayed constant through the eras, a surprising result of this analysis is that fearmongering using ‘us vs them’ rhetoric has strongly increased. Presidents are increasingly acknowledging division and conflict in their rhetoric, reflecting a broader shift toward more polarized political discourse in the United States.