Analyzing Surge Type Glacial Velocity and the Presence of the Karakoram Anomaly in Select N. Hemisphere Glaciers
Introduction
Glaciers have become an icon of anthropogenic warming and climate change. It is well known throughout the world that most glaciers are in steep decline. However, there is one small region in Pakistan, the Karakoram, which has emerged as the largest of the very few examples of glaciers continuing to grow today Hewitt (2005). Glaciers in this region have exhibited mass stability or even expansion, contrasting the mass loss seen in the nearby Himalayas and Tibetan Plateau as well as other mid-latitude glaciers globally Kapnick et al. (2014). The Karakoram has become well known for being an anomaly. Glaciologists have hypothesized factors such as great elevations, relief, and distinctive climatic regimes as responsible for what has become known as the “Karakoram Anomaly” Hewitt (2005). From 2000-2020, “the region has shown balanced to slightly positive glacier budgets, an increase in glacier ice flow speeds, stable to partially advancing glacier termini and widespread glacier surge activity” Farinotti et al. (2020).Surge-type glaciers, like the Karakoram Anamoly, go through a quiescent phase, where flow is normal and slow, as well as an active phase where they surge to a higher flow velocity, often factored 10-100 times the normal flow Davies (2020).
This analysis compares the South Rimo Glacier in the Karakoram with two other “Surge Type” glaciers: the Medvezhiy Glacier in the Pamir mountains of nearby Tajikistan and the Sít’ Kusá Glacier in Alaska. The project seeks to answer whether there is evidence of the Karakoram Anomaly within this comparison, using statistical analysis of glacial velocity. Increased velocity is associated with decreased glacial mass, as a glacier can slide across a bed rock surface faster if there is less mass (due to a decrease in friction) keeping it in place. We do this by creating preprocessing visualizations, analyzing mean velocities over time as well as within seasonality, and visualizing cumulative mean velocity and acceleration trends, combined with overall evaluation and comparison.
Goal of Analysis
This analysis compares the South Rimo Glacier in the Karakoram with two other “Surge Type” glaciers: the Medvezhiy Glacier in the Pamir mountains of nearby Tajikistan and the Sít’ Kusá Glacier in Alaska. The project seeks to answer two main questions: Is there evidence of the Karakoram Anomaly within this comparison, as we would expect given prior research on the region; and how does the effect compare to the other two surge-type glaciers we examine, one of which is located geographically close to the Karakoram mountain range, the Medvezhiy Glacier in Tajikistan, and the other, the Sít’ Kusá Glacier in Alaska, which has very different climate and located in a completely different region than the other two.
We answer these questions using statistical analysis of glacial velocity. Increased velocity is associated with decreased glacial mass, as a glacier can slide across a bed rock surface faster if there is less mass (due to a decrease in friction) keeping it in place. By creating preprocessing visualizations, analyzing mean velocities over time as well as within seasonality, and visualizing cumulative mean velocity and acceleration trends, we evaluate the velocity trends exhibited and compare.
About the Data
For this project we utilized the NASA earthaccess python library to get velocity maps for the South Rimo Glacier in the Karakoram mountain range in Pakistan, the Sít’ Kusá Glacier in Alaska, and the Medvezhiy Glacier in Tajikistan. For reproducability, the raw data is included in the repository – data for each glacier is available within the data/Karakoram and data/Other_Glaciers directories, with no download required for user. If you are interested in downloading the data for further exploration, the eda notebook has lines of code commented out that would enable you to download the dataset we used, as well as the data for other glaciers.
The dataset was trimmed to make each dataset match the time interval of the smallest data set, the Alaskan glacier, in order for more accurate comparison and user readability. Additionally, our datasets are not all of the same density: though we trimmed them all to have the same start and end date, the dataset for the Karakoram glacier is far more robust than the dataset for the Alaskan glacier, which may skew some results.
One assumption we made about the dataset, which are all GeoTIFF format, is that they are all georeferenced correctly and in the same way (i.e. using the same projection), so that each point is mapping to the correct location. It would be unlikely for a dataset like this to be georeferenced differently across a single glacier, and differences in projections across the different glaciers would not be problematic for comparision, so this felt like a safe and necessary assumption to make. Another assumption we made about the dataset is that keeping N/A or missing variables was worth doing, despite it leaving some white spaces on our maps.
Data Exploration
Import the necessary packages:
from IPython.display import ImageImportant Notes Regarding the Geography of Each Glacier:
As we begin our exploration of the data, there are a few important aspects of each glacier that are worth noting. All climatic data was retrieved through this incredibly useful tool, in which we input each glacier name and got a wealth of information.
The Karakoram South Rimo Glacier has an average elevation of approximately 5,588m above sea level Topographic Maps (2025), approximately 1,000m higher than the The Medvezhiy Glacier in Tajikistan NASA Earth Observatory (2025), and approximately 2,000m higher than The Sít’ Kusá Glacier in Alaska CoastView (2024).
The Karakoram South Rimo Glacier is approximately 19 degrees F colder than The Medvezhiy Glacier in Tajikistan on average across all seasons, and approximately 30 degrees F colder than The Sít’ Kusá Glacier in Alaska on average across all seasons. Interestingly, The Karakoram South Rimo Glacier recieves the least precipation (on average) of all three glaciers, and the Alaskan glacier recieves the most.
This places the Karakoram at the highest elevation, with the coldest temperatures, and the least rainfall.
All three glaciers experience similar seasons, with their highest temperatures occurring in July/August and lowest temperatures occurring between October-February.
Mean Velocities Over Time
We analyzed the mean velocities over time of our three glaciers, starting with the Karakoram glacier.
Through this analysis we strip away the location-based data to look at the average velocities in a more simple, easily-digestible manner. This gave us an initial understanding of the corresponding magnitude size (noting that the scales are different between the two images), and patterns.
Image(filename = 'figures/K_meanmag_chart.png', width=600, height=600)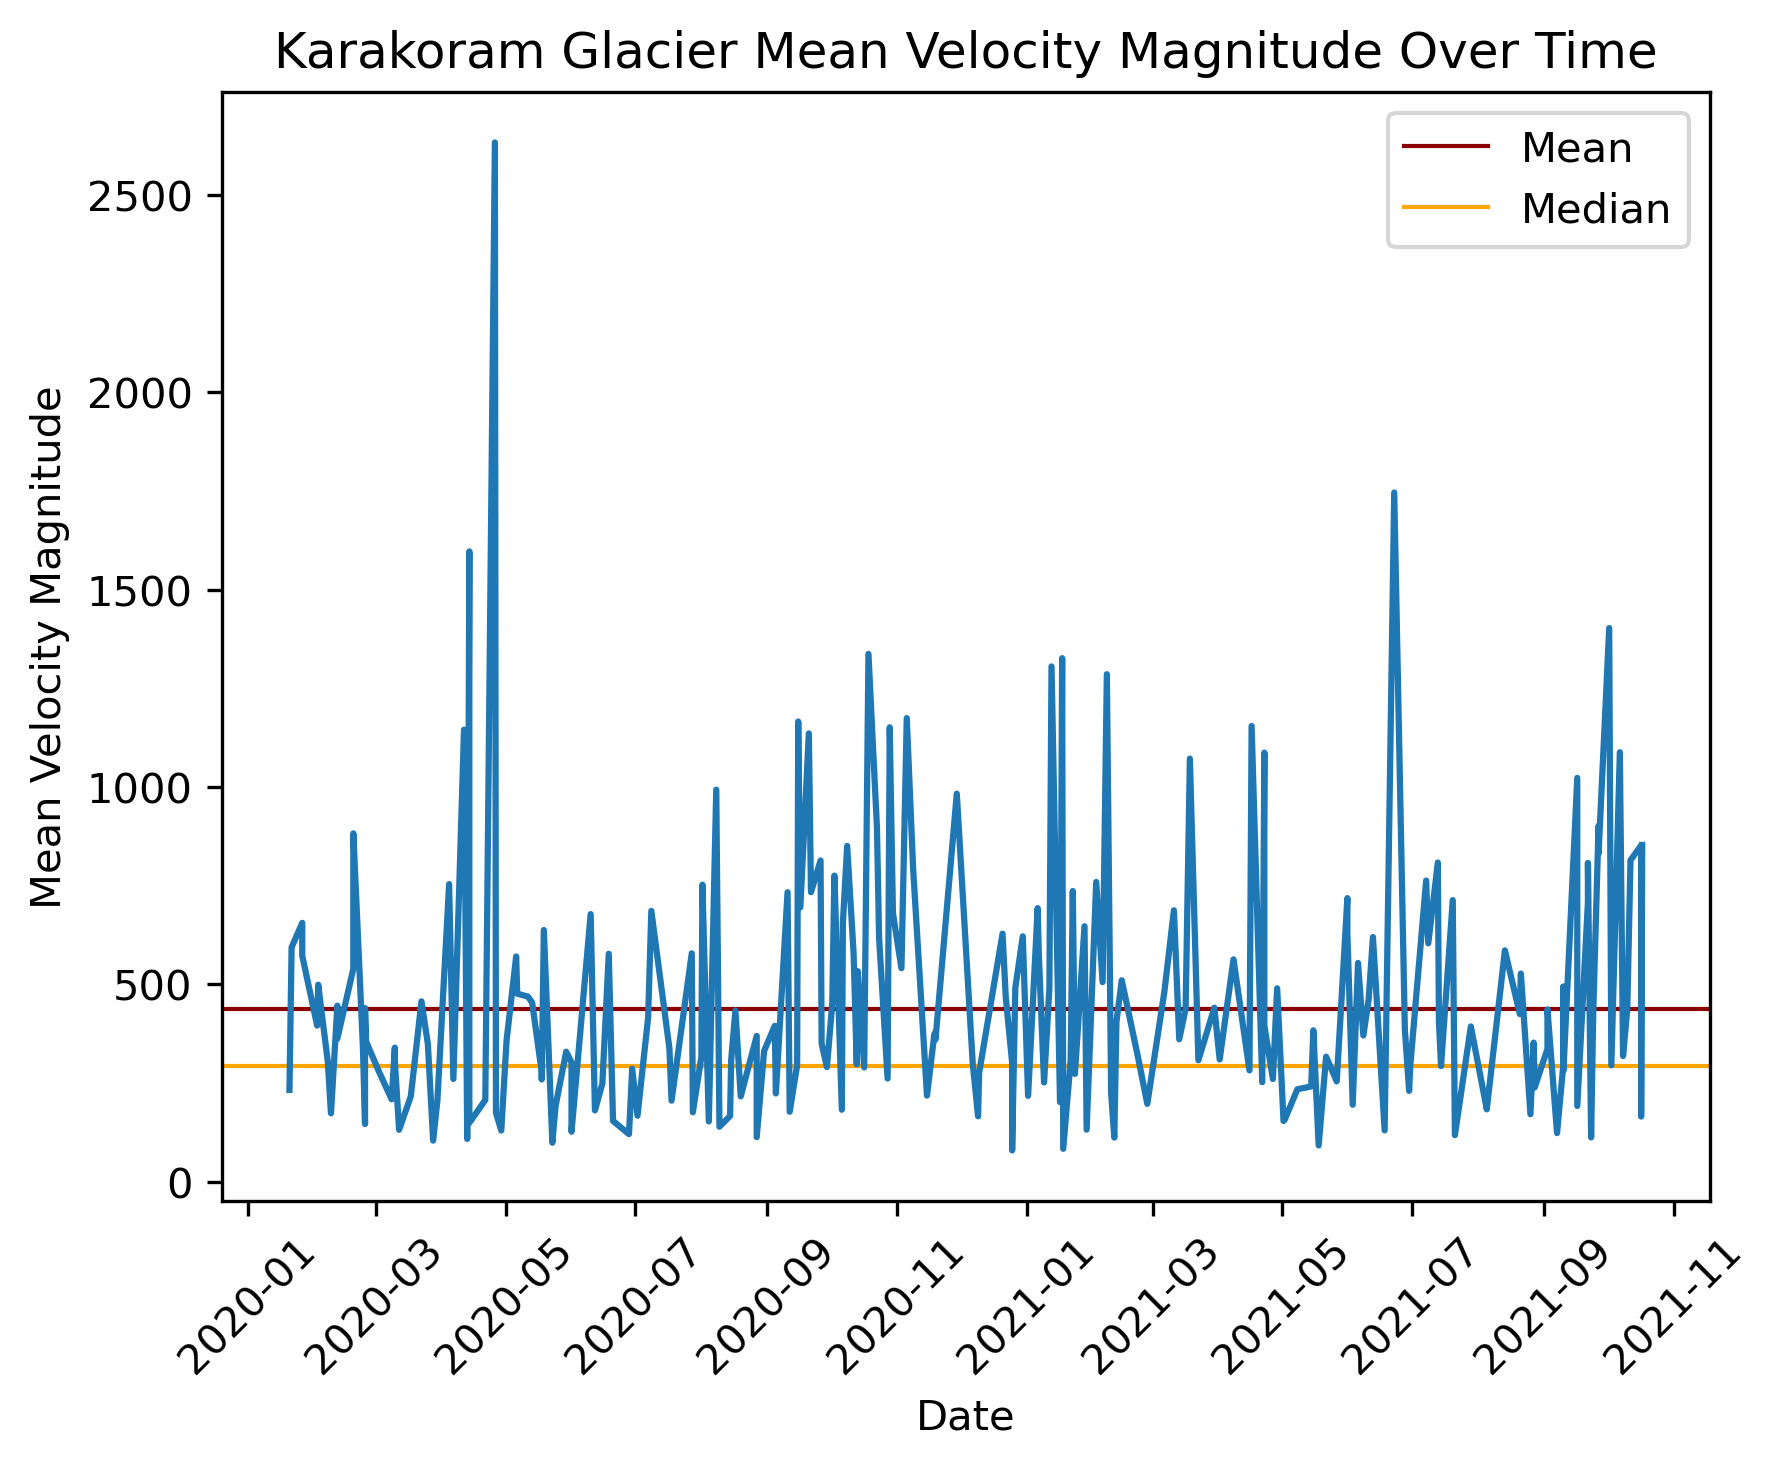
Image(filename = 'figures/NK_meanmag_chart.png', width=800, height=800)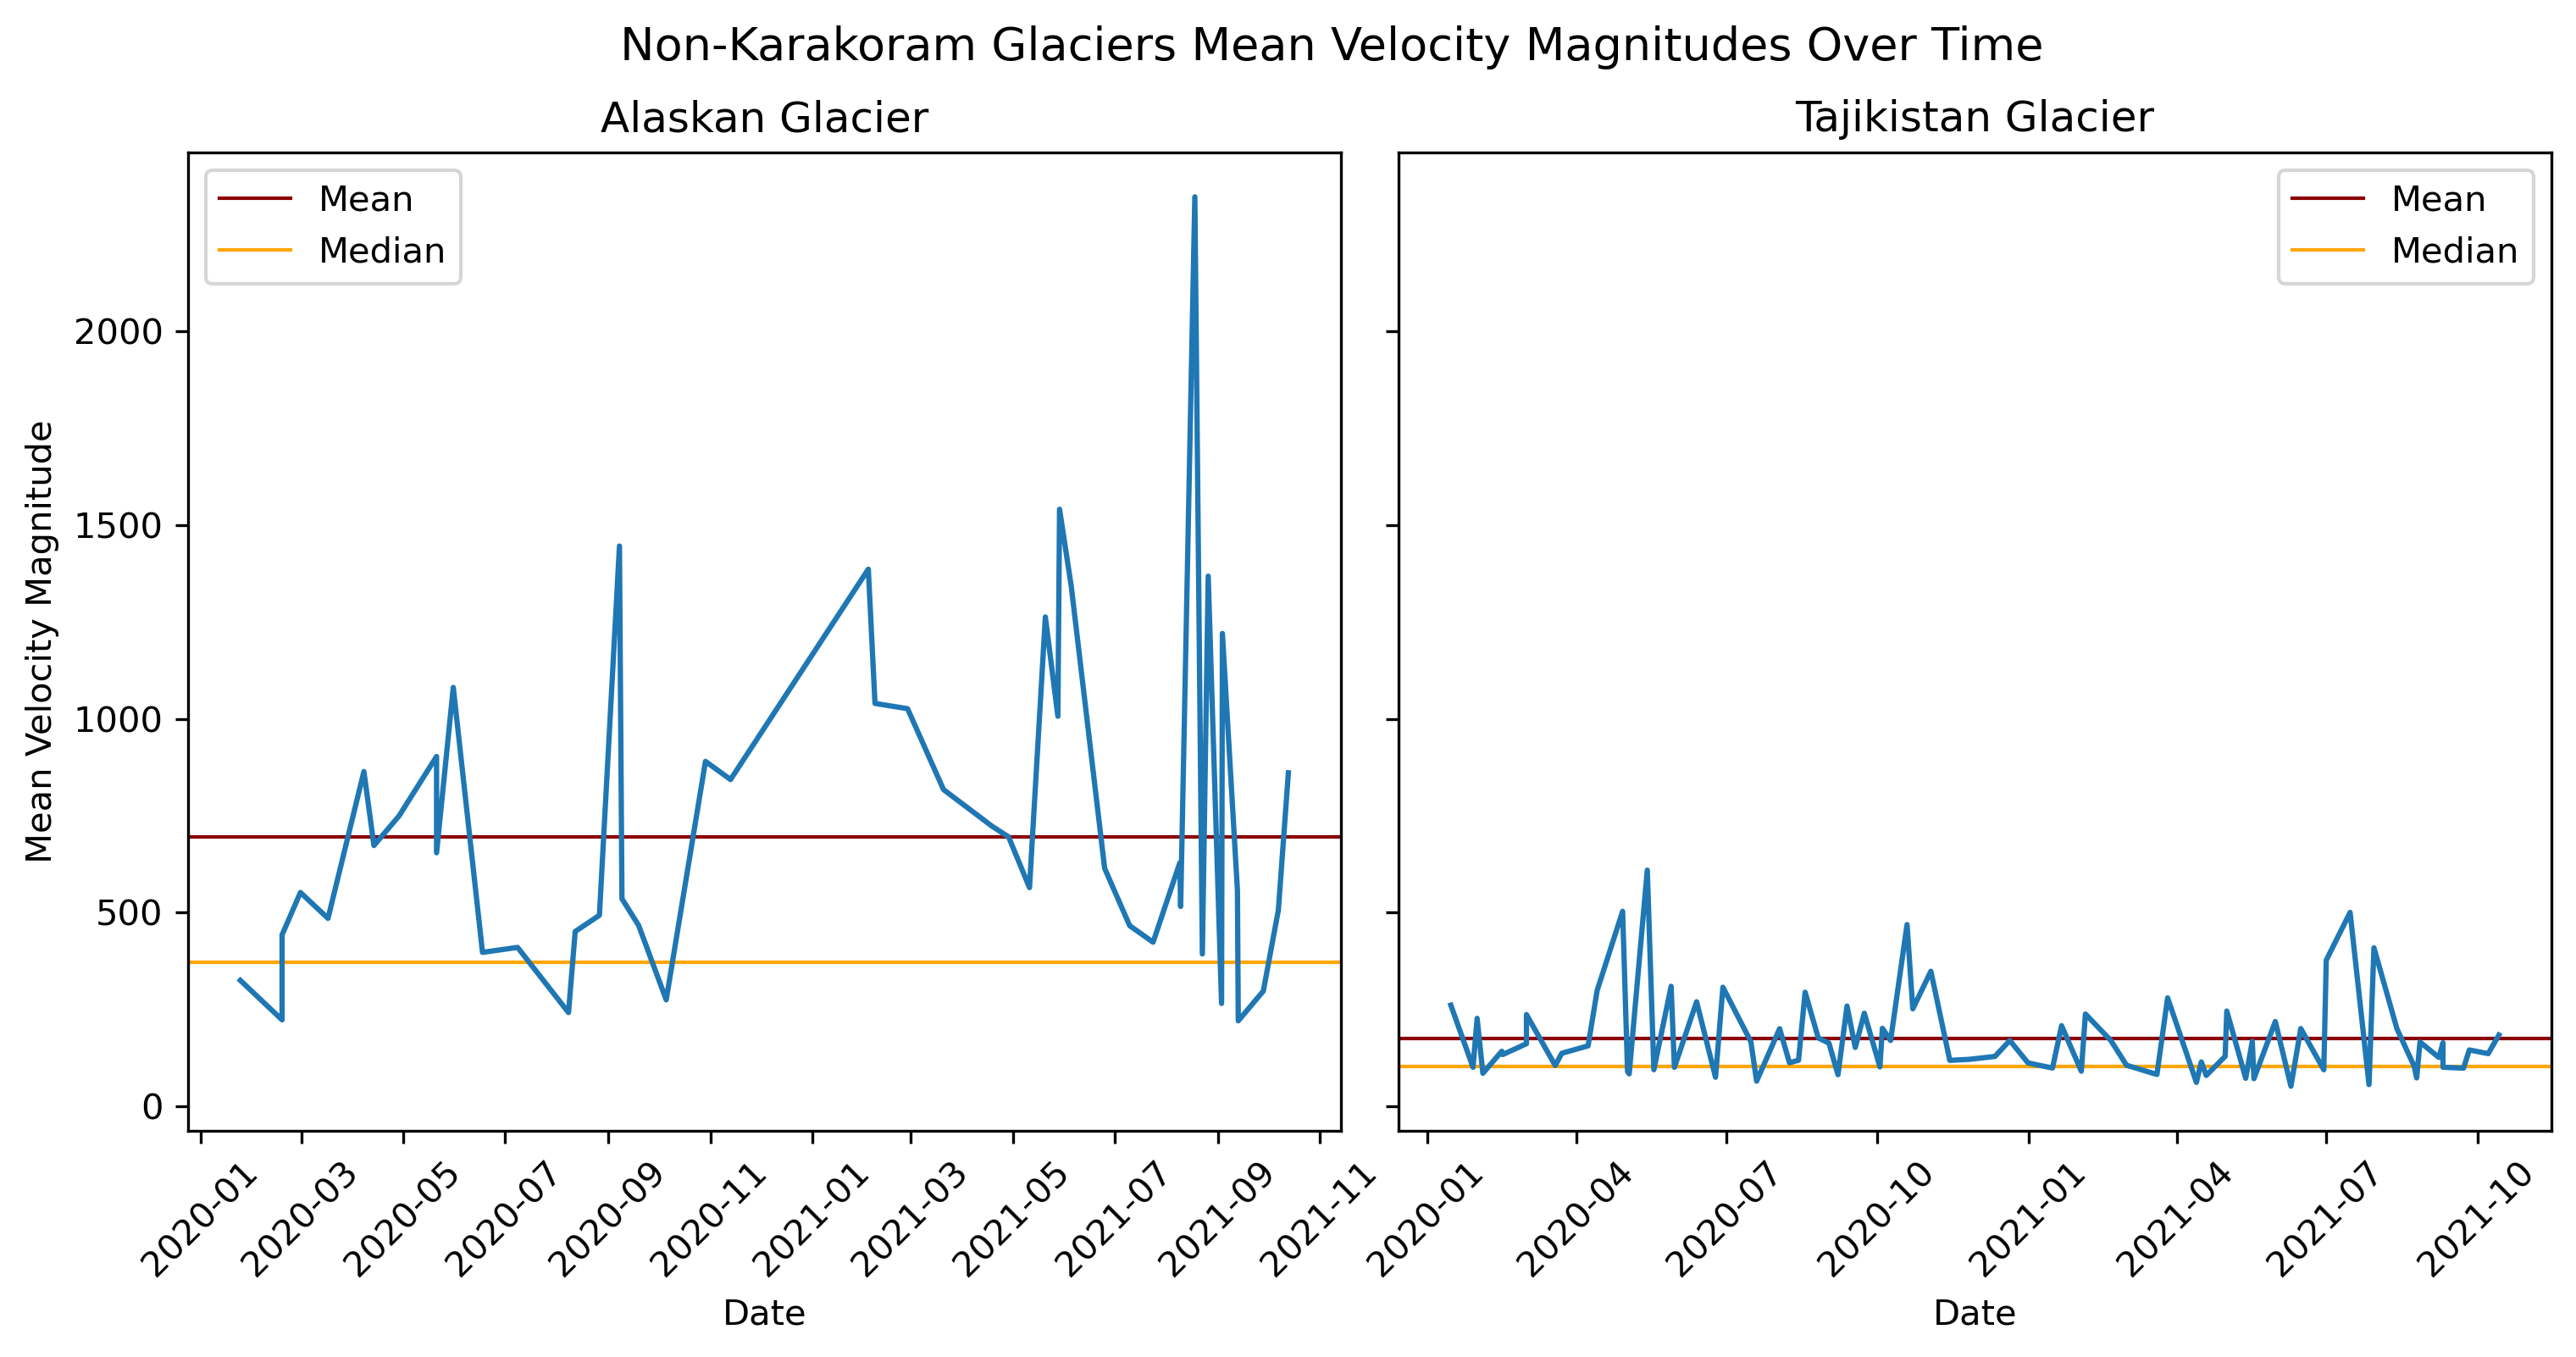
We can see that all three glaciers experienced a peak of some form around April, 2020, though this was exagerated in the Karakoram data, which returned to its normal fluctuations after that. The Karakoram glacier experiences cyclical velocity changes throughout each month, it appears, unlike the Alaskan and Tajikistan glaciers which seem to fluctuate more randomly – even experiencing some of their largest velocity magnitudes during the coldest months.
Seasonality of Glaciers
Here we zoom in to look at a mean velocity for each month to get a better understanding of the seasonal velocity changes.
Image(filename = 'figures/K_seasonality_chart.png', width=600, height=600)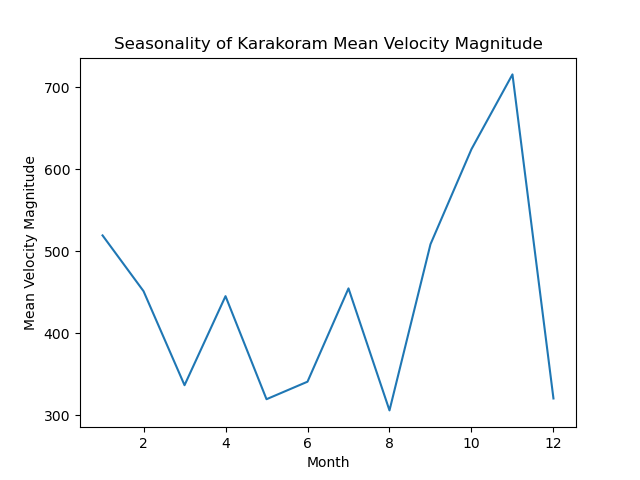
Image(filename = 'figures/NK_seasonality_chart.png', width=800, height=800)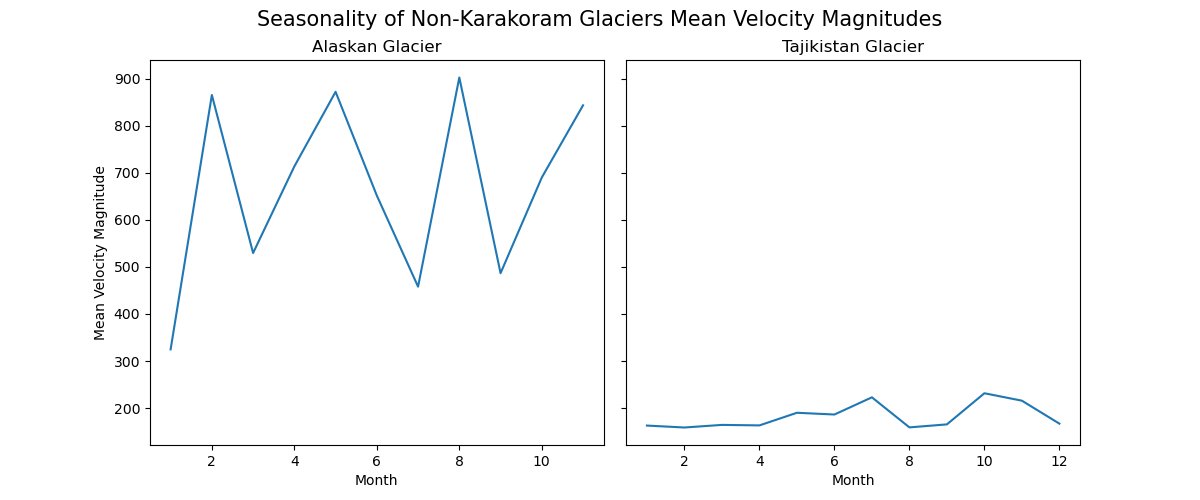
Similar to the last set of graphics, here we can really see the staggering difference in velocity magnitude across all 3 glaciers, particularly the Tajikistan Glacier, and how the Tajikistan and Karakoram glaciers, which are geographically close to each other, experience similar elevations in velocity magnitudes during the same colder months.
Mapping Velocity and Acceleration of Glaciers
We analyzed the location-based data through Mean Velocity Magnitude Maps.
Image(filename = 'figures/K_meanmag_map.png', width=600, height=600)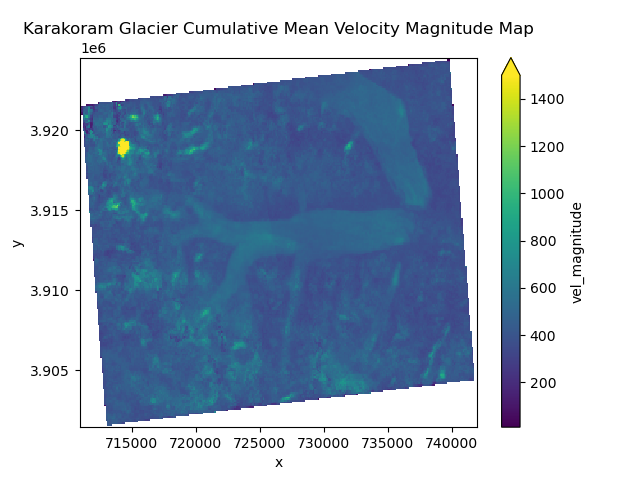
Image(filename = 'figures/NK_meanmag_map.png', width=1200, height=1200)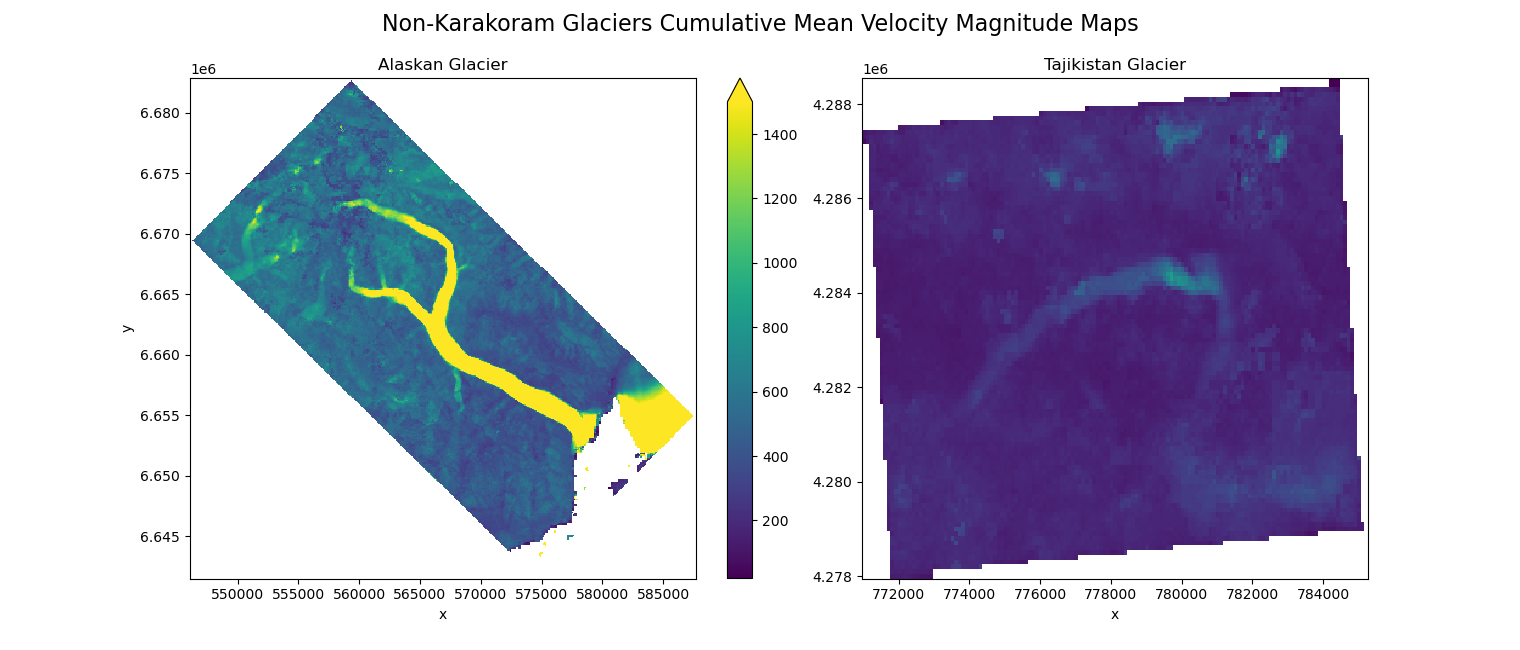
We observe here that the Alaskan Glacier experiences a larger velocity magnitude than either of the other two more geographically close glaciers.
We conducted a similar analysis of the acceleration trends of each glacier.
Note: the red indicates negative acceleration, and the blue indicates positive acceleration.
Image(filename = 'figures/K_acceleration_map.png', width=600, height=600)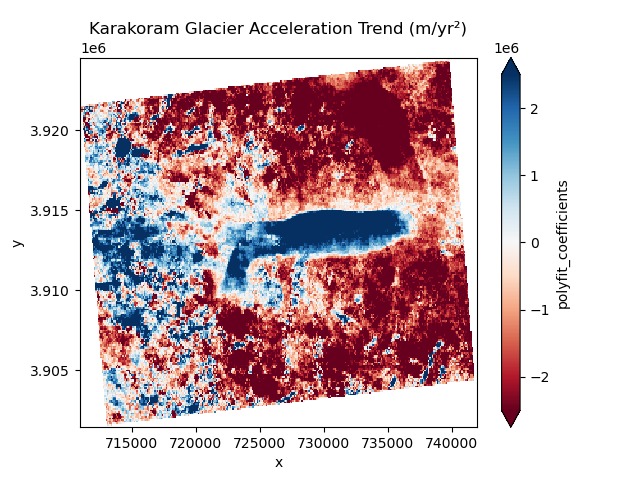
Image(filename = 'figures/NK_acceleration_map.png', width=1200, height=1200)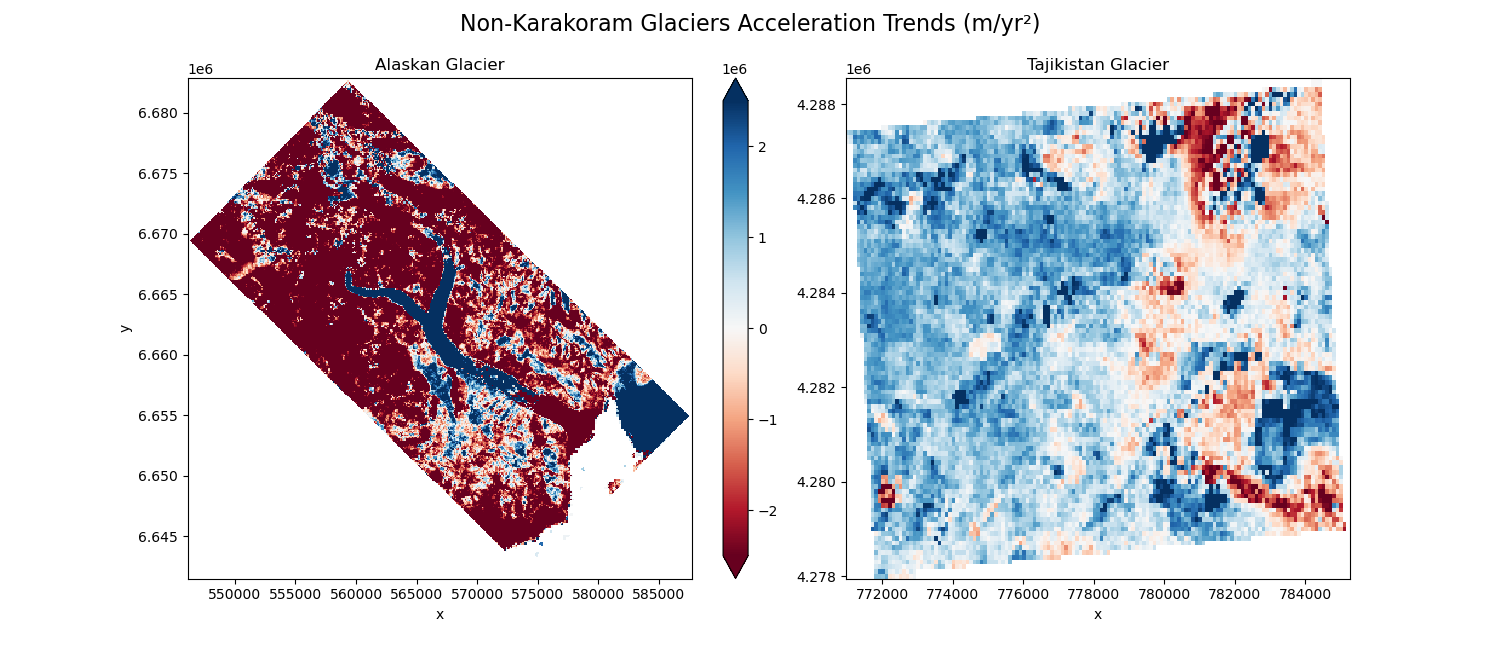
Here we observe that the Alaskan and Karakoram Glaciers exhibit similar acceleration trends, where the glacier itself is accelerating and the area around it is decelerating, while the Tajikistan Glacier appears to be accelerating over the majority of the mapped region, including the glacier area.
We calculated glacier velocity statistics for comparison.
Image(filename='figures/glacier_velocity_comparisons_table.png', width=900)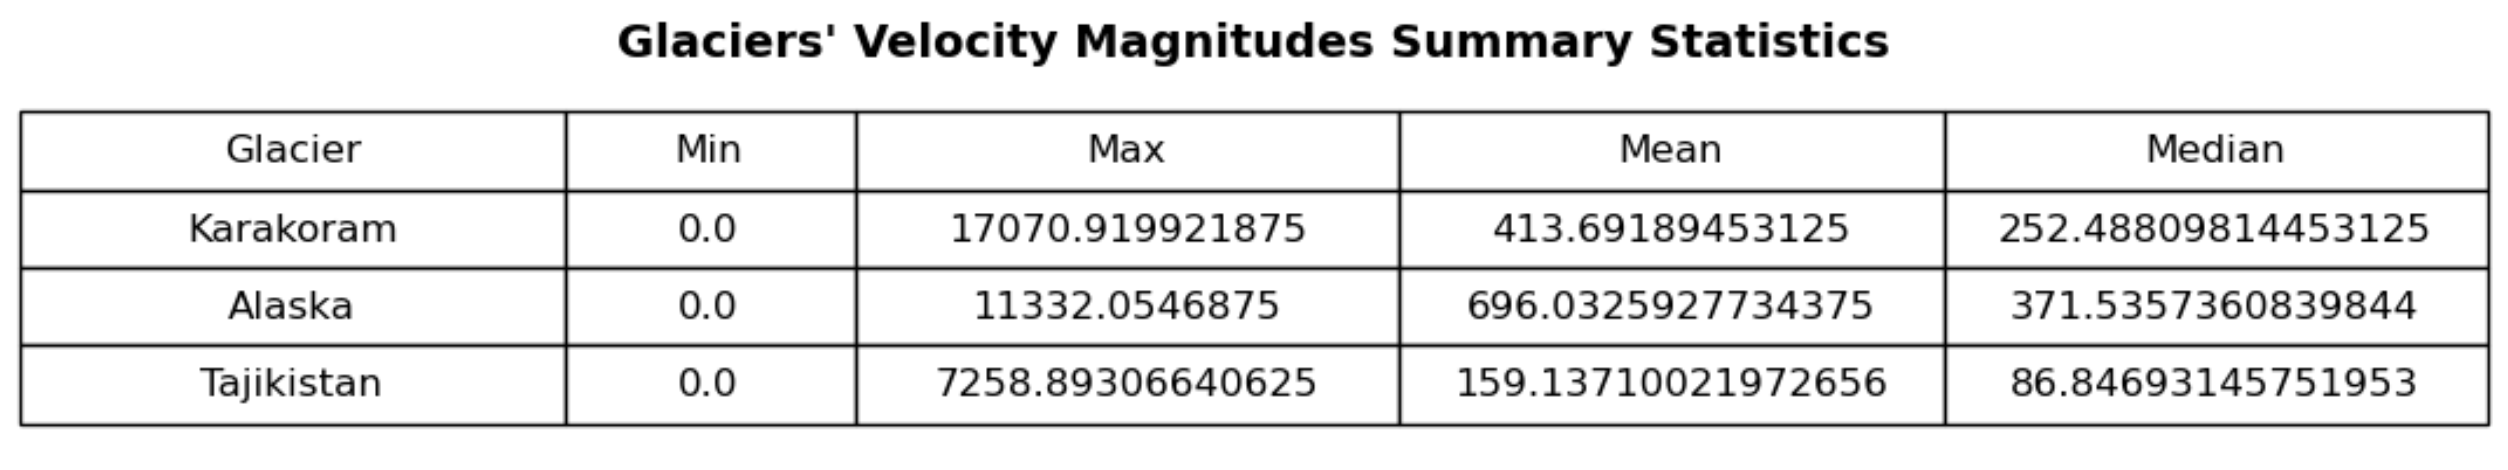
Results and Interpretation
From the figures shown in the table, the Tajikistan glacier appears to be the slowest moving glacier, followed by the Karakoram, then the Alaskan glacier.
From these results it is hard to detect the Karakoram anamoly in action, or see any significant difference between the Karakoram compared to the other two glaciers. It is important to note the size difference in the glaciers, and that we expect, based on previous research, that smaller glaciers will have a higher velocity due to the lower mass decreasing friction between the ground and the glacier, and resulting in faster movement. This is observable in the data. The increased velocity could also be due to the narrowness of the glacier, causing what may be a similar movement of mass to the larger of glaciers to move at a more rapid pace.
While there is insuffient evidence within this surface-level analysis of the Karakoram Anamoly, this could be due to a number of factors that would require further exploration and analysis. Our results are inconclusive, but this analysis is hardly enough to disprove the wealth of pre-existing research suggesting the existence of the Karakoram Anamoly.
Further Analysis
Given the inconclusive results, we have more questions than answers, but this analysis has been a starting point leading us to generate suggestions for continued research.
A relevant area requiring further analysis would be annual precipitation in relation to glacier movement. Is the melt caused by movement accompanied with sufficient snowfall to maintain the size through balanced gains/losses? By only analyzing the velocity we are missing this crucial piece of information regarding the stablization of glaciers. In addition, if it possible to graph the elevation changes of each glacier over time, this would provide a more standardized way of analyzing these changes across each glacier.
Another point for further analysis would be longer trends. Our data only looks at a year in time, but perhaps over longer geological timescales we could find patterns in each glaciers’ velocity changes, including seeing surge events that may otherwise heavily skew the data. This data could also be paired with a mapping of climatic features to understand how these changes in velocity might be associated with changes in local climate (like average temperature or precipitation).
We hope this research provides valuable insight for further research on this vital topic.
Author Contributions
Ethan Briel
Created the testing functions
Created the Binder link
Added
LICENSEConverted functions to working a form and added into
glacierspackageInitialized
glacierspackage with appropriate testsMade the
.gitignorefile
Param Gandhi
Worked on
eda.ipynband analysis notebooks:karakoram_analysis.ipynbandnon-karakoram_analysis.ipynbCreated
environment.ymlCreated
MakefileCreated
MySTsiteCreated
pdf_buildsDid final release on Zenodo (+DOI badge)
Eden Lange
Wrote all sections in
main.ipynbexcept for the introductionCompleted analysis
Created bibliography and added all MyST citations
Char Tomlinson
Created the
README.mdCreated the
index.mdWrote Introduction in
main.ipynbAttended Office Hours for Assistance
- Hewitt, K. (2005). The Karakoram Anomaly? Glacier Expansion and the `Elevation Effect,’ Karakoram Himalaya. Mountain Research and Development, 25(4), 332–340. https://www.jstor.org/stable/3674440
- Kapnick, S. B., Delworth, T. L., Ashfaq, M., Malyshev, S., & Milly, P. C. D. (2014). Snowfall Less Sensitive to Warming in Karakoram than in Himalayas Due to a Unique Seasonal Cycle. Nature Geoscience, 7(11), 834–840. 10.1038/ngeo2269
- Farinotti, D., Immerzeel, W. W., de Kok, R. J., Quincey, D. J., & Dehecq, A. (2020). Manifestations and Mechanisms of the Karakoram Glacier Anomaly. Nature Geoscience, 13(1), 8–16. 10.1038/s41561-019-0513-5
- Davies, B. (2020, June). Surging Glaciers. https://www.antarcticglaciers.org/glacier-processes/glacier-flow-2/surging-glaciers/
- Topographic Maps. (2025). South Rimo Glacier Topographic Map, Elevation, Terrain. https://en-gb.topographic-map.com/map-dvpckl/South-Rimo-Glacier/
- NASA Earth Observatory. (2025, December 3). Medvezhiy Glacier Advances. https://www.earthobservatory.nasa.gov/images/51498/medvezhiy-glacier-advances
- CoastView. (2024, May 2). Turner Glacier, Disenchantment Bay. https://coastview.org/2024/05/02/turner-glacier-disenchantment-bay/